
Mon, Oct. 19 · 1 game · Stat Lab #26: Fielding runs: putting defense on the scoreboard · 6-min read
Press time 15:41 CEST · Final 1/1 · Statcast: posted
- Last night: 1 final
- Game of the Night: Guardians 3, Rays 7 · Drama 2.28 ★★★
- World Series: TB-MIL: Not started
- Stat Lab #26: Fielding runs: putting defense on the scoreboard
- Jump to: Glance · Scoreboard · Bracket · Game of the Night · Performers · Statcast · Stat Lab · World · Web · Terms · Sources
Last Night at a Glance
- AL Championship Series Game 6: Guardians 3, Rays 7 · Rays win 4-2
Scoreboard
| Matchup | Final | Drama | Decisions | Links |
|---|---|---|---|---|
| CLE @ TB | 3-7 | 2.28 ★★★ | W Peralta · L Armstrong | Box · Savant |
The Bracket
Wild Card Series (best of three, every game at the higher seed)
- AL: White Sox at Astros: White Sox win 2-0.
- AL: Red Sox at Yankees: Yankees win 2-0.
- NL: Phillies at Braves: Braves win 2-1.
- NL: Cubs at Padres: Padres win 2-0.
Division Series (best of five)
- AL: Yankees at Rays: Rays win 3-0.
- AL: White Sox at Guardians: Guardians win 3-2.
- NL: Padres at Brewers: Brewers win 3-1.
- NL: Braves at Dodgers: Dodgers win 3-1.
Championship Series (best of seven)
- AL: Guardians at Rays: Rays win 4-2.
- NL: Dodgers at Brewers: Brewers win 4-0.
World Series (best of seven)
- Rays at Brewers: Not started · Game 1: Sat, Oct. 24, 02:00 CEST (8:00 p.m. ET).
Game of the Night: Guardians 3, Rays 7
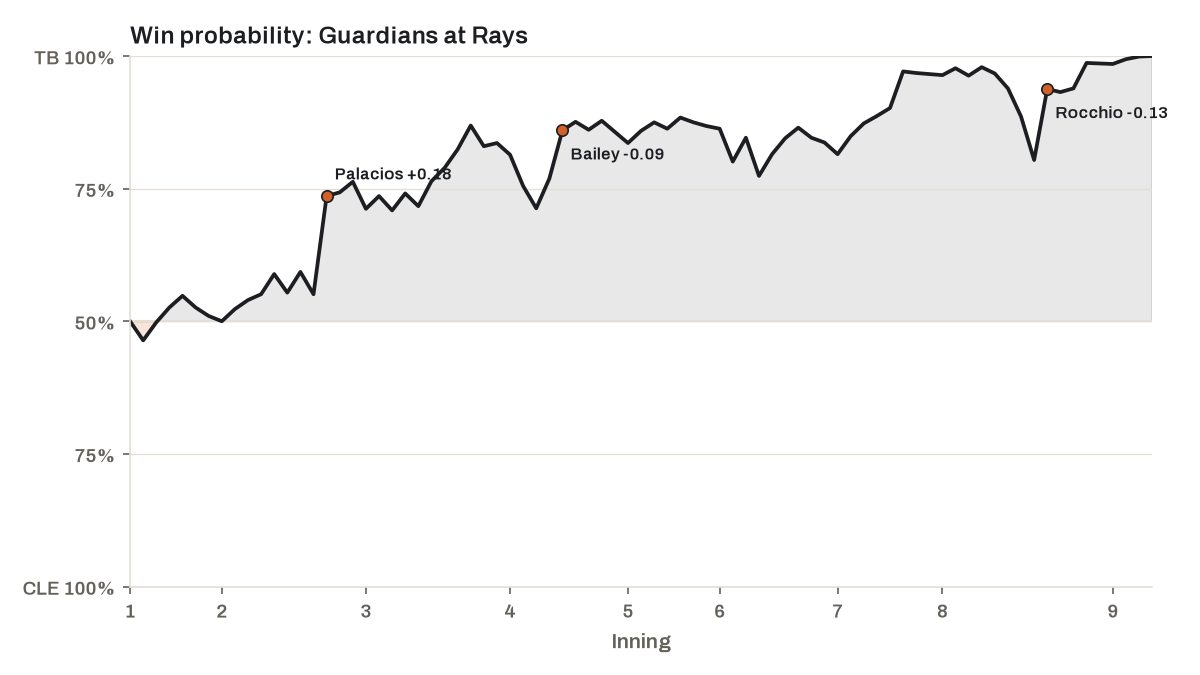
- Drama Index 2.28 ★★★ · 0 lead changes · peak leverage 5.26 (top 8th)
- In history: 1,122nd most dramatic of 1,878 postseason games since 1903 (Retrosheet)
- Top WPA: Richie Palacios +0.17 (batter) · Freddy Peralta +0.16 (pitcher) · Cam Booser +0.14 (pitcher)
- Bottom WPA: Ian Seymour -0.16 (pitcher) · Brayan Rocchio -0.15 (batter) · Tim Herrin -0.12 (pitcher)
Watch: condensed game, 21 min · recap, 3 min (MLB.com)
| Inning | Matchup | Result | Win probability | WPA | LI |
|---|---|---|---|---|---|
| Bot 2nd | Richie Palacios vs. Tim Herrin | Double | TB 56% → 74% | +0.18 | 1.96 |
| Top 8th | Brayan Rocchio vs. Kevin Kelly | Strikeout | CLE 20% → 6% | -0.13 | 5.26 |
| Top 4th | Patrick Bailey vs. Freddy Peralta | Grounded Into DP | CLE 23% → 14% | -0.09 | 2.07 |
Top Performers
| Starter | Game | IP | H | R (ER) | BB | K | Pitches | GSc |
|---|---|---|---|---|---|---|---|---|
| Freddy Peralta | TB vs. CLE | 5.1 | 5 | 1 | 3 | 3 | 84 | 56 |
| Shawn Armstrong | CLE @ TB | 1.0 | 1 | 1 | 0 | 0 | 9 | 41 |
| Batter | Team | Line | WPA |
|---|---|---|---|
| Richie Palacios | TB | 2-for-4, 2B, 2 RBI | +0.17 |
| Junior Caminero | TB | 2-for-3, HR, 2 RBI, BB | +0.12 |
| Nathaniel Lowe | CLE | 2-for-3, 1 RBI, BB | +0.10 |
| Angel Martínez | CLE | 0-for-0, 1 RBI | +0.08 |
| Yandy Díaz | TB | 1-for-4, HR, 2 RBI | +0.02 |
Statcast Corner
| Category | Player | Detail | Where |
|---|---|---|---|
| Hardest-hit ball | Yandy Díaz (TB) | 111.9 mph (180 km/h) home run off Hunter Gaddis | CLE @ TB, bot 8 |
| Fastest pitch | Daniel Espino (CLE) | 100.7 mph (162 km/h) four-seamer to Victor Mesa Jr. | CLE @ TB, bot 5 |
| Unluckiest out | Yandy Díaz (TB) | line drive out, xBA .789, 111.0 mph (179 km/h), caught by CF Petey Halpin | CLE @ TB, bot 4 |
Stat Lab · Lesson 26: Fielding runs: putting defense on the scoreboard
Some balls are outs almost every time; some almost never. Defensive metrics grade each one by how often an average fielder at that position makes the play, then add up what the fielder did above or below that. This season Jonny DeLuca comes out 10.0 runs ahead of an average fielder. He played again last night, in a 7-3 Rays win over the Guardians.
The idea. Fielding runs measure defense in runs against an average fielder at the same position. They are the fielding line of WAR, so a shortstop is compared only with shortstops and a center fielder only with center fielders. How hard the position is gets credited separately, by the positional adjustment, so nobody is paid twice for it. Statcast’s Outs Above Average uses tracking data to set, for every ball, the chance an average fielder turns it into an out; Defensive Runs Saved is another widely used system. Making a play an average fielder rarely makes earns a lot of credit. Making a routine one earns almost none, and missing it costs plenty.
The math. His WAR line in runs: batting +0.6, baserunning +1.8, fielding +10.0, positional −2.0. Fielding runs become wins like every other piece: 10.0 ÷ 9.82 runs per win = 1.0 wins. That is 43% of his 23.5 runs above replacement (10.0 ÷ 23.5). Add the positional credit and his whole defensive value is +10.0 − 2.0 = +8.0 runs.
The scale. Most regulars sit near zero: 69% of the 282 hitters with 200-plus plate appearances are within five runs of average either way. Roughly, +10 over a season is excellent and −10 poor. Jonny DeLuca’s +10.0 ranks 15th. At the other end, CJ Abrams of the Nationals stands at −13.8. The gap between the two, 23.8 runs, is worth about 2.4 wins.
What it doesn’t tell you:
- Defensive numbers are noisy. A season holds only so many hard chances, so a fielder can swing by several runs from one year to the next; three seasons say far more than one (sample size).
- Systems disagree. Outs Above Average and Defensive Runs Saved grade plays differently and can rate the same fielder several runs apart.
- Fielding runs judge plays, not tools. Sprint speed and a strong arm help, but first step, routes and positioning decide whether the ball is caught.
Try it. Open Baseball Savant’s Outs Above Average leaderboard and find Jonny DeLuca. Does his OAA agree with his +10.0 fielding runs here? Then check his earlier seasons: is the glove steady, or did one year do the lifting?
Go deeper: MLB Glossary: Outs Above Average · Baseball Savant: Outs Above Average leaderboard · FanGraphs Library: defense overview
Check yourself
- Q1. How many wins is Jonny DeLuca’s glove worth this season?
- Q2. What does Outs Above Average grade each ball by?
- Q3. Why is a routine catch worth almost nothing in fielding runs?
Show answers
- A1. About 1.0: +10.0 fielding runs ÷ 9.82 runs per win.
- A2. How often an average fielder turns that ball into an out. A fielder gains credit for the outs he makes above that expectation and loses it for the ones he misses.
- A3. An average fielder makes it nearly every time, so making it adds almost nothing above average. Missing it, though, costs a lot.
Around the World
- Venezuelan Winter League: Navegantes 11, Cardenales 7 ★★★★
- Arizona Fall League: Javelinas 5, Scorpions 0 (shutout) ★★ · Desert Dogs 1, Rafters 7 ★ · Solar Sox 7, Saguaros 4 ★
Around the Web
Last Night’s Games
- Guardians 3, Rays 7 — On 18th anniversary of first World Series berth, Rays reach third as AL’s best team (MLB.com)
News
- Rays-Brewers World Series Game 1 FAQ (Fri., 8 ET on FOX) — MLB.com
- Athletics hire Taylor Smith as president of baseball operations — AP via NBC Sports
- 2026 MLB playoff bracket: Schedule and scores as Rays advance to World Series to face Brewers — CBS Sports
- World Series odds: Brewers open as favorites against Rays — The Athletic (subscription)
Transactions & Rumors
- Aaron Boone To Return As Yankees’ Manager In 2027 — MLB Trade Rumors
- The Rangers’ Roster Bind — MLB Trade Rumors
- From Ronaldo’s tantrum to Harden’s trade tirade: When sports stars call out their employers — The Athletic (subscription)
Analysis · Listen (7)
Analysis
- Undeniable: Rays Strike Early and Late To Advance to World Series — FanGraphs
- Top 10 Players Hitting Arbitration for the First Time — Just Baseball
- Who’s the Best Defensive Center Fielder in Baseball? — Baseball Prospectus (subscription)
- Cup of Coffee: October 19, 2026 — Cup of Coffee (subscription)
Listen
- A banner day for Rays! Next up: World Series — MLB Morning Lineup · 13 min
- RAYS OF HOPE – Drew Rasmussen and Yandy Diaz Bring Tampa Bay to Brink of the World Series — Locked On MLB · 34 min
- Rays ONE WIN From World Series! Can Guardians Survive Game 6? — Rates & Barrels · 59 min
Terms in This Post
Drama Index · Leverage Index (LI) · Win Probability Added (WPA) · Hard-Hit Rate (HardHit%) · Barrel · Fielding Runs · every term in the Glossary
Sources & Notes
Built automatically from MLB Stats API and Baseball Savant data; numbers through Oct. 19, 2026, with FIP, xFIP, WAR and wRC+ up to a day behind. Highlight videos link to MLB.com. The information used here was obtained free of charge from and is copyrighted by Retrosheet. Interested parties may contact Retrosheet at “www.retrosheet.org”. How this site works