
Sun, Oct. 18 · 1 game · Stat Lab #25: The positional adjustment: why a DH needs a bigger bat · 7-min read
Press time 17:45 CEST · Final 1/1 · Statcast: posted
- Last night: 1 final
- Game of the Night: Rays 3, Guardians 1 · Drama 2.24 ★★★
- Championship Series: CLE-TB: Rays lead 3-2 · LAD-MIL: Brewers win 4-0
- Tonight: 1 game · first pitch Tue 02:08 CEST
- Stat Lab #25: The positional adjustment: why a DH needs a bigger bat
- Jump to: Glance · Tonight · Scoreboard · Bracket · Game of the Night · Performers · Statcast · Stat Lab · World · Web · Terms · Sources
Last Night at a Glance
- AL Championship Series Game 5: Rays 3, Guardians 1 · Rays lead 3-2
Tonight (CEST)
Mon, Oct. 19 · 1 game · none before 23:00 CEST · starters as of 17:45 CEST
| Matchup | Start CEST (ET) | Series | Away SP | Home SP | Stakes |
|---|---|---|---|---|---|
| CLE 85-77 @ TB 98-64 | Tue 02:08 (8:08 p.m.) | ALCS G6 of 7 | Shawn Armstrong (0/41 GS) 4.58 · 4.43 · 9.7% · 35.1 | Freddy Peralta 4.42 · 4.28 · 12.7% · 169.0 | — |
Scoreboard
| Matchup | Final | Drama | Decisions | Links |
|---|---|---|---|---|
| TB @ CLE | 3-1 | 2.24 ★★★ | W Rasmussen · L Messick · S Baker | Box · Savant |
The Bracket
Wild Card Series (best of three, every game at the higher seed)
- AL: White Sox at Astros: White Sox win 2-0.
- AL: Red Sox at Yankees: Yankees win 2-0.
- NL: Phillies at Braves: Braves win 2-1.
- NL: Cubs at Padres: Padres win 2-0.
Division Series (best of five)
- AL: Yankees at Rays: Rays win 3-0.
- AL: White Sox at Guardians: Guardians win 3-2.
- NL: Padres at Brewers: Brewers win 3-1.
- NL: Braves at Dodgers: Dodgers win 3-1.
Championship Series (best of seven)
- AL: Guardians at Rays: Rays lead 3-2 · Game 4: Sat, Oct. 17, 02:00 CEST (8:00 p.m. ET) · history: up 3-2 in a best-of-seven, 80 of 117 won the series.
- NL: Dodgers at Brewers: Brewers win 4-0.
Game of the Night: Rays 3, Guardians 1
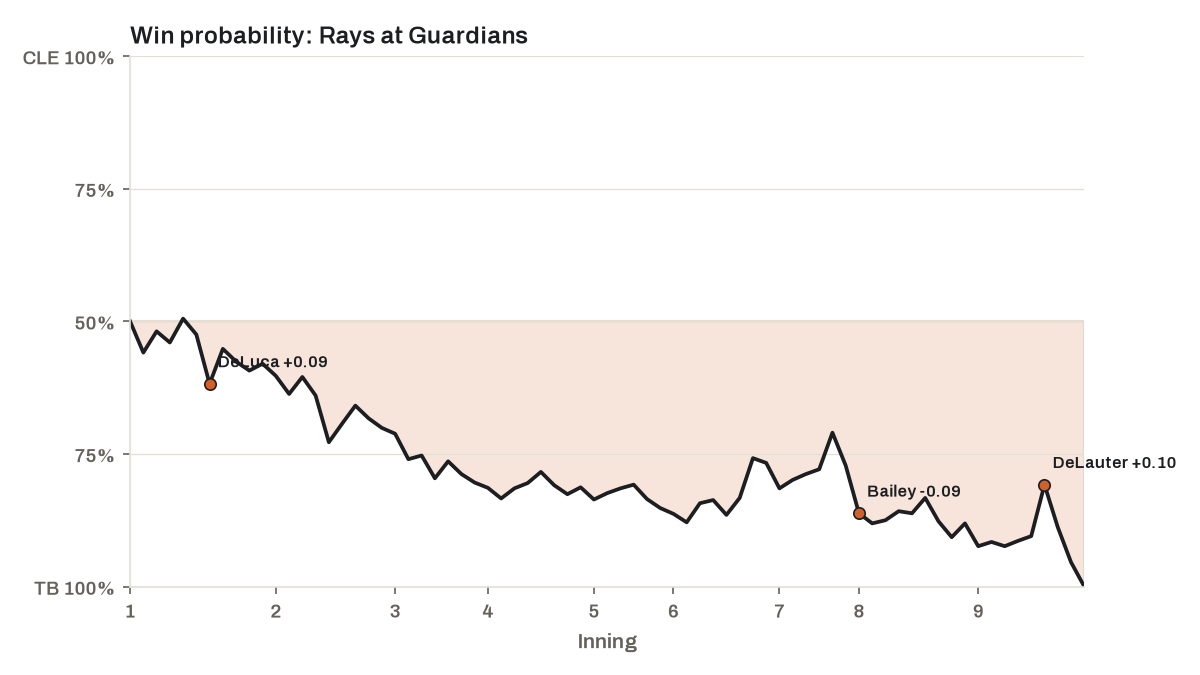
- Drama Index 2.24 ★★★ · 0 lead changes · peak leverage 3.70 (bottom 9th)
- In history: 1,034th most dramatic of 1,878 postseason games since 1903 (Retrosheet)
- Top WPA: Drew Rasmussen +0.32 (pitcher) · Bryan Baker +0.10 (pitcher) · Chase DeLauter +0.08 (batter)
- Bottom WPA: Travis Bazzana -0.16 (batter) · Jo Adell -0.14 (batter) · Patrick Bailey -0.12 (batter)
Watch: condensed game, 24 min · recap, 3 min (MLB.com)
| Inning | Matchup | Result | Win probability | WPA | LI |
|---|---|---|---|---|---|
| Bot 9th | Chase DeLauter vs. Bryan Baker | Walk | CLE 10% → 19% | +0.10 | 1.88 |
| Top 1st | Jonny DeLuca vs. Parker Messick | Walk | TB 52% → 62% | +0.09 | 2.83 |
| Bot 7th | Patrick Bailey vs. Drew Rasmussen | Grounded Into DP | CLE 23% → 14% | -0.09 | 2.22 |
Top Performers
| Starter | Game | IP | H | R (ER) | BB | K | Pitches | GSc |
|---|---|---|---|---|---|---|---|---|
| Drew Rasmussen | TB @ CLE | 7.0 | 4 | 1 | 1 | 6 | 95 | 75 |
| Parker Messick | CLE vs. TB | 2.0 | 5 | 2 | 2 | 3 | 57 | 35 |
| Batter | Team | Line | WPA |
|---|---|---|---|
| Chase DeLauter | CLE | 1-for-3, 1 RBI, BB | +0.08 |
| Yandy Díaz | TB | 3-for-5, 2B | +0.07 |
| Chandler Simpson | TB | 2-for-3, 2B, SB | +0.06 |
| Jonny DeLuca | TB | 0-for-3, 1 RBI, BB | +0.04 |
| Steven Kwan | CLE | 2-for-4 | +0.02 |
Statcast Corner
| Category | Player | Detail | Where |
|---|---|---|---|
| Hardest-hit ball | Liam Hicks (TB) | 110.1 mph (177 km/h) grounder out off Parker Messick | TB @ CLE, top 1 |
| Fastest pitch | Cade Smith (CLE) | 98.4 mph (158 km/h) four-seamer to Jonathan Aranda | TB @ CLE, top 9 |
Stat Lab · Lesson 25: The positional adjustment: why a DH needs a bigger bat
Yandy Díaz was the designated hitter in a 3-1 Rays win over the Guardians last night. His bat has been worth +19.8 runs this season, yet WAR takes 16.6 runs back for the position he plays. That charge is the positional adjustment, and it is why first basemen and designated hitters need big bats.
The idea. The positional adjustment is a fixed credit or charge for each position per 162 games, prorated by how much a player actually plays there. It exists because positions are not equally hard. Almost any hitter can be a designated hitter, and a DH gets no fielding credit because he never takes the field. Catcher and shortstop are the hardest jobs on the diamond, and few players can handle them at all. Fielding runs can’t see that difference, because they compare each fielder only with others at his position. The adjustment puts a slugging DH and a light-hitting catcher on one scale.
The math. Yandy Díaz has −16.6 positional runs in 154 games: −16.6 ÷ 154 × 162 = −17.5 per 162 games, exactly the full-time designated hitter’s rate. J.T. Realmuto holds the league’s biggest credit, +9.1 (a rate close to the catcher’s +12.5 per 162 games). The gap: +9.1 − (−16.6) = 25.7 runs, and 25.7 ÷ 9.82 runs per win = 2.6 wins.
| Position | Runs per 162 games |
|---|---|
| Catcher | +12.5 |
| Shortstop | +7.5 |
| Second base, third base, center field | +2.5 |
| Left field, right field | −7.5 |
| First base | −12.5 |
| Designated hitter | −17.5 |
The scale. So Yandy Díaz’s bat has to beat J.T. Realmuto’s by 25.7 runs just to make up for position. It does: +19.8 batting runs against −18.0 is an edge of 37.8, which beats the gap by 12.1. With everything added, their WAR is 2.5 for him and 0.7 for J.T. Realmuto. The rule of thumb: over a full season a DH must hit about 17.5 runs above average just to be an average player, while a catcher who fields like an average catcher can hit 12.5 runs below average and still get there.
What it doesn’t tell you:
- The values are a convention. Baseball-Reference’s WAR uses somewhat different ones.
- Batting stats ignore position. wRC+ compares a hitter with all hitters, so the same wRC+ is worth more from a catcher than from a designated hitter.
- The charge is the same for everyone at a position. A great defensive first baseman still carries the first-base charge; his glove shows up in fielding runs instead.
Try it. Pick a designated hitter and a catcher from tonight’s lineups and look up their WAR components. Add batting and positional runs for each: who comes out ahead once the position is counted?
Go deeper: FanGraphs Library: WAR for position players · MLB Glossary: designated hitter · MLB Glossary: catcher
Check yourself
- Q1. How many wins apart do Yandy Díaz and J.T. Realmuto start, just from their positions?
- Q2. Why does the designated hitter carry the biggest positional charge?
- Q3. Over a full season, a catcher fields like an average catcher and hits 10 runs below average. Is he below average overall?
Show answers
- A1. 2.6: +9.1 − (−16.6) = 25.7 runs, ÷ 9.82 runs per win.
- A2. Almost any hitter can do the job, so it is the easiest position to fill, and a DH does no fielding at all.
- A3. No. His +12.5 positional credit more than covers the 10 batting runs, leaving him about 2.5 runs above average before baserunning and the small league adjustment.
Around the World
- KBO (Korea): Twins 3, Tigers 6 (Semi-playoff)
- CPBL (Taiwan): Brothers 1, Dragons 3 (Taiwan Series Game 2)
- Dominican Winter League: Leones 4, Tigres 5 (10, walk-off) · Toros 6, Estrellas 4 · Gigantes 1, Aguilas 4
- Venezuelan Winter League: Tiburones 4, Tigres 5 · Leones 8, Caribes 4 · Bravos 8, Aguilas 2 · Cardenales 8, Navegantes 5
- Mexican Pacific League: Obregon 0, Mexicali 5 (shutout) · Culiacan 7, Los Mochis 5 (10) · Jalisco 9, Nayarit 6 · Hermosillo 10, Navojoa 6 · Guasave 10, Mazatlan 4
Around the Web
Last Night’s Games
- Rays 3, Guardians 1 — Rasmussen puts Rays on his back again to build on historic postseason (MLB.com)
News
- Winning formula in Game 5? ‘Rays baseball at its finest’ — MLB.com
- 2026 MLB Playoffs Tracker: Bracket, schedule, results, scores, matchups for AL, NL postseason games — NBC Sports
- 2026 MLB playoff bracket: Schedule and scores as Rays take ALCS lead, Guardians facing elimination in Game 6 — CBS Sports
- The Brewers’ bat boy in 1982 is now an NHL GM. Bill Zito tells his World Series story — The Athletic (subscription)
Transactions & Rumors
- How Paul Blackburn Became An Elite Reliever — MLB Trade Rumors
- Mariners Had Interest In Carlos Mendoza For Managerial Opening — MLB Trade Rumors
Analysis · Listen (6)
Analysis
- After Forcing Messick Into an Early Exit, Rays Take 3-2 ALCS Lead — FanGraphs
- Which MLB Players Should Get the Biggest Arbitration Raises? — Just Baseball
- 1914: The First Major World Series Upset — Pitcher List
- ALCS Game 5 Preview: The Stars are Aligned — Baseball Prospectus (subscription)
Listen
- Rays ride Rasmussen to huge Game 5 win in ALCS — MLB Morning Lineup · 13 min
- TAMPA BAY TIES ALCS – Rays’ OFFENSE Explodes as Cleveland NEEDS Game 5 — Locked On MLB · 35 min
Terms in This Post
Drama Index · Leverage Index (LI) · Win Probability Added (WPA) · Hard-Hit Rate (HardHit%) · Barrel · Positional Adjustment · every term in the Glossary
Sources & Notes
Built automatically from MLB Stats API, Baseball Savant, MyKBO Stats and CPBL Stats data; numbers through Oct. 18, 2026, with FIP, xFIP, WAR and wRC+ up to a day behind. Highlight videos link to MLB.com. The information used here was obtained free of charge from and is copyrighted by Retrosheet. Interested parties may contact Retrosheet at “www.retrosheet.org”. How this site works