
Thu, Oct. 15 · 2 games · Stat Lab #22: Win expectancy: how low can a winner go? · 7-min read
Press time 12:07 CEST · Final 2/2 · Statcast: posted
- Last night: 2 final
- Game of the Night: Brewers 6, Dodgers 4 · Drama 3.47 ★★★★
- Championship Series: CLE-TB: Guardians lead 2-1 · LAD-MIL: Brewers win 4-0
- Tonight: 1 game · first pitch Sat 02:00 CEST
- Stat Lab #22: Win expectancy: how low can a winner go?
- Jump to: Glance · Tonight · Scoreboard · Bracket · Game of the Night · Watch · Performers · Statcast · Stat Lab · Wire · World · Web · Terms · Sources
Last Night at a Glance
- AL Championship Series Game 3: Rays 2, Guardians 3 · Guardians lead 2-1
- NL Championship Series Game 4: Brewers 6, Dodgers 4 · Brewers win 4-0
- Comebacks: Brewers from 4 down: Brewers 6, Dodgers 4
Tonight (CEST)
Fri, Oct. 16 · 1 game · none before 23:00 CEST · starters as of 12:06 CEST
| Matchup | Start CEST (ET) | Series | Away SP | Home SP | Stakes |
|---|---|---|---|---|---|
| TB 98-64 @ CLE 85-77 | Sat 02:00 (8:00 p.m.) | ALCS G4 of 7 CLE leads 2-1 | Nick Martinez 3.10 · 3.96 · 11.5% · 180.0 | TBD | — |
Scoreboard
| Matchup | Final | Drama | Decisions | Links |
|---|---|---|---|---|
| MIL @ LAD | 6-4 | 3.47 ★★★★ | W Romero · L Scott · S Ashby | Box · Savant |
| TB @ CLE | 2-3 | 2.31 ★★★ | W Williams · L Jax · S Smith | Box · Savant |
The Bracket
Wild Card Series (best of three, every game at the higher seed)
- AL: White Sox at Astros: White Sox win 2-0.
- AL: Red Sox at Yankees: Yankees win 2-0.
- NL: Phillies at Braves: Braves win 2-1.
- NL: Cubs at Padres: Padres win 2-0.
Division Series (best of five)
- AL: Yankees at Rays: Rays win 3-0.
- AL: White Sox at Guardians: Guardians win 3-2.
- NL: Padres at Brewers: Brewers win 3-1.
- NL: Braves at Dodgers: Dodgers win 3-1.
Championship Series (best of seven)
- AL: Guardians at Rays: Guardians lead 2-1 · Game 4: Sat, Oct. 17, 02:00 CEST (8:00 p.m. ET) · history: up 2-1 in a best-of-seven, 109 of 155 won the series.
- NL: Dodgers at Brewers: Brewers win 4-0.
Game of the Night: Brewers 6, Dodgers 4
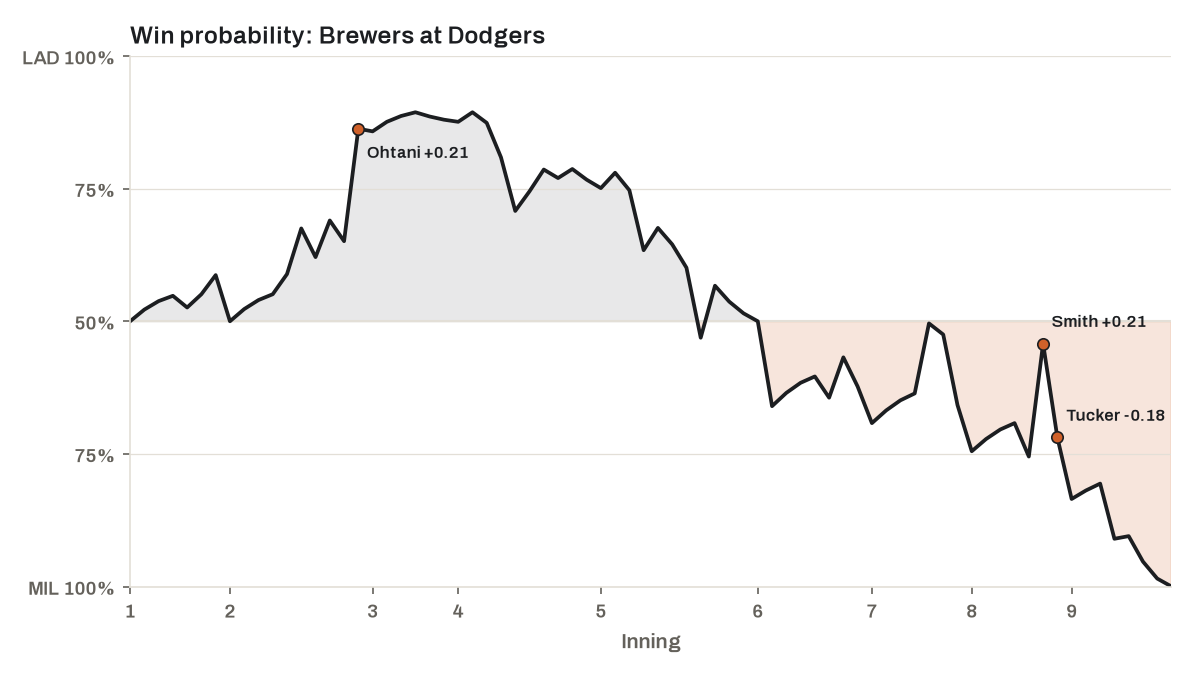
- Drama Index 3.47 ★★★★ · 1 lead change · Brewers came back from 4 down · peak leverage 4.27 (bottom 8th)
- In history: 339th most dramatic of 1,878 postseason games since 1903 (Retrosheet)
- Top WPA: Aaron Ashby +0.35 (pitcher) · Jake Bauers +0.19 (batter) · David Hamilton +0.18 (batter)
- Bottom WPA: Dustin May -0.22 (pitcher) · Christian Yelich -0.17 (batter) · Jackson Chourio -0.11 (batter)
Watch: condensed game, 21 min · recap, 3 min (MLB.com)
| Inning | Matchup | Result | Win probability | WPA | LI |
|---|---|---|---|---|---|
| Bot 8th | Will Smith vs. Aaron Ashby | Double | LAD 24% → 46% | +0.21 | 1.90 |
| Bot 2nd | Shohei Ohtani vs. Dustin May | Home Run | LAD 65% → 86% | +0.21 | 1.54 |
| Bot 8th | Kyle Tucker vs. Aaron Ashby | Flyout | LAD 46% → 28% | -0.18 | 4.13 |
Watch
- Rays 2, Guardians 3 · condensed game, 16 min (MLB.com)
Top Performers
| Starter | Game | IP | H | R (ER) | BB | K | Pitches | GSc |
|---|---|---|---|---|---|---|---|---|
| Gavin Williams | CLE vs. TB | 5.0 | 2 | 2 | 1 | 9 | 70 | 67 |
| Tyler Glasnow | LAD vs. MIL | 4.1 | 3 | 4 | 2 | 6 | 79 | 50 |
| Shane Drohan | MIL @ LAD | 1.0 | 1 | 1 | 2 | 1 | 25 | 38 |
| Griffin Jax | TB @ CLE | 4.0 | 5 | 3 | 2 | 2 | 67 | 37 |
| Batter | Team | Line | WPA |
|---|---|---|---|
| Chandler Simpson | TB | 1-for-3, 3B, 2 RBI | +0.19 |
| Petey Halpin | CLE | 1-for-3, HR, 2 RBI | +0.19 |
| Jake Bauers | MIL | 1-for-3, 2B, 3 RBI, BB | +0.19 |
| David Hamilton | MIL | 2-for-4, HR, 2 RBI, SB | +0.18 |
| Andy Pages | LAD | 2-for-4, 2B, 1 RBI | +0.15 |
Statcast Corner
| Category | Player | Detail | Where |
|---|---|---|---|
| Hardest-hit ball | Shohei Ohtani (LAD) | 113.1 mph (182 km/h) home run off Dustin May | MIL @ LAD, bot 2 |
| Fastest pitch | Daniel Espino (CLE) | 101.0 mph (163 km/h) four-seamer to Yandy Díaz | TB @ CLE, top 6 |
| Unluckiest out | Garrett Mitchell (MIL) | line drive out, xBA .789, 110.8 mph (178 km/h), caught by CF Andy Pages | MIL @ LAD, top 8 |
Stat Lab · Lesson 22: Win expectancy: how low can a winner go?
The Brewers beat the Dodgers 6-4 last night. Yet in the top of the 3rd, by the win-probability model in MLB’s game feed, they had only a 10.6% chance of doing it: about 1 in 9. Where does a number like that come from?
The idea. Win expectancy is the chance that a team wins from a given spot in a game: the inning, which half, the outs, the runners on base and the score. It is estimated from history: take every past game that reached the same spot and count how often that team went on to win. The win-probability numbers in MLB’s game feed come from a model of this kind, updated after every play. It is the game-sized cousin of run expectancy, which does the same for runs in an inning. How far one play moves it is WPA; how much is at stake before the play is the Leverage Index.
The math. At the low point the Brewers stood at 10.6%. Read it as a frequency: of 100 teams in that spot, about 11 go on to win, roughly 1 in 9 (100 ÷ 10.6 = 9.4). They began the game at 50.0%, fell 39.4 points to the low, then climbed 89.4 points to 100% by the end. The biggest single step up after the low was 71.9 − 54.2 = 17.7 points, in the bottom of the 8th.
The scale. Across last night’s two decided games, two winners dipped below 50% at some point (the first pitch counts), and only one below 25%. An honest model’s 20% should come true about one time in five: if teams at 20% never won, the model would be wrong. So a comeback from 10.6% is unusual, not a miracle.
What it doesn’t tell you:
- A table built from game situations treats both teams as average. It does not know who is pitching, who is on deck, or how tired the bullpen is.
- The past games behind it come from many seasons and parks, and a three-run lead is safer when runs are scarce than when they are plentiful.
- Win expectancy says how likely a win was, not who deserves credit for the swing. That is the job of WPA.
Try it. Pick a close game tonight and, at the start of each inning, guess the leading team’s chance of winning. Afterward, check your guesses against the game’s win-probability chart (FanGraphs publishes one for every game).
Go deeper: MLB Glossary: win expectancy · FanGraphs Library: win expectancy · MLB Glossary: walk-off
Check yourself
- Q1. The Brewers bottomed out at 10.6%. Out of 100 teams in that spot, about how many would win?
- Q2. Why is a one-run lead worth more in the ninth inning than in the first?
- Q3. Two games are tied in the bottom of the eighth, with the same outs and the same runners on base. Does win expectancy give both home teams the same chance?
Show answers
- A1. About 11. That is what a 10.6% win expectancy means.
- A2. The trailing team has far fewer outs left to make up the run, so more of the past games from that spot ended with the leader winning.
- A3. Yes. It only knows the situation, not who is pitching or batting, so identical situations get identical numbers.
Transaction Wire
- Braves: outrighted CF DaShawn Keirsey Jr. to Gwinnett Stripers
- Braves: selected 2B Brett Wisely from Gwinnett Stripers · MLB Trade Rumors
- Padres: signed RHP Tatsuya Nogami to a minor league deal
Around the World
- Venezuelan Winter League: Bravos 3, Leones 1 · Navegantes 3, Tigres 11 · Cardenales 0, Aguilas 2 (shutout) · Tiburones 5, Caribes 15
- Mexican Pacific League: Mexicali 2, Hermosillo 6 · Jalisco 11, Nayarit 8 · Los Mochis 4, Guasave 5 (walk-off) · Navojoa 1, Obregon 4 · Mazatlan 8, Culiacan 6
- Arizona Fall League: Saguaros 17, Desert Dogs 8 · Scorpions 8, Javelinas 5 · Solar Sox 14, Rafters 9 (10)
Around the Web
Last Night’s Games
- Brewers 6, Dodgers 4 — Will LA target Skubal in free agency? Here are the questions facing Dodgers this offseason (MLB.com)
- Rays 2, Guardians 3 — 13 K’s, 3 hits, 1 frustrating loss: Rays’ bats go quiet in G3 (MLB.com)
News
- After 13 seasons, 2-time World Series champ Rojas calls it a career — MLB.com
- White Sox, GM Chris Getz face hard act to follow in 2027, in spite of unexpected playoff run — AP via NBC Sports
- Phillies plan to keep Trea Turner at shortstop, hire ex-Mets manager as infield coach — CBS Sports
- Can a $400 Shohei Ohtani action figure sell? Todd McFarlane bets on it — The Athletic (subscription)
Transactions & Rumors
- Offseason Outlook: Chicago White Sox — MLB Trade Rumors
- Miguel Rojas Announces Retirement — MLB Trade Rumors
Analysis · Listen (7)
Analysis
- Brewers Rally Past Dodgers To Sweep Their Way to the World Series — FanGraphs
- 44 Years In the Making: The Milwaukee Brewers Are Headed Back To the World Series — Just Baseball
- What They’re Saying ’26: Buster Posey and Tony Vitello Edition — Baseball Prospectus (subscription)
- Cup of Coffee: October 15, 2026 — Cup of Coffee (subscription)
Listen
- Brewers sweep away champs to reach World Series — MLB Morning Lineup · 17 min
- BREWERS ON FIRE: Milwaukee Stun Dodgers, Jake Bauers CRUSHES Blake Snell in NLCS Showdown — Locked On MLB · 32 min
- MLB Playoff Pitching Has Gone WILD | Bullpen Fatigue — Rates & Barrels · 60 min
Terms in This Post
Drama Index · Hard-Hit Rate (HardHit%) · Barrel · every term in the Glossary
Sources & Notes
Built automatically from MLB Stats API and Baseball Savant data; numbers through Oct. 15, 2026, with FIP, xFIP, WAR and wRC+ up to a day behind. Highlight videos link to MLB.com. The information used here was obtained free of charge from and is copyrighted by Retrosheet. Interested parties may contact Retrosheet at “www.retrosheet.org”. How this site works