
Wed, Oct. 14 · 1 game · Stat Lab #21: Replacement level: below average can still be valuable · 7-min read
Press time 15:34 CEST · Final 1/1 · Statcast: posted
- Last night: 1 final
- Game of the Night: Brewers 6, Dodgers 2 · Drama 2.84 ★★★
- Championship Series: CLE-TB: Tied 1-1 · LAD-MIL: Brewers lead 3-0
- Tonight: 2 games · first pitch 19:00 CEST
- Stat Lab #21: Replacement level: below average can still be valuable
- Jump to: Glance · Tonight · Scoreboard · Bracket · Game of the Night · Performers · Statcast · Stat Lab · Wire · World · Web · Terms · Sources
Last Night at a Glance
- NL Championship Series Game 3: Brewers 6, Dodgers 2 · Brewers lead 3-0
Tonight (CEST)
Thu, Oct. 15 · 2 games · 1 starts before 23:00 CEST · starters as of 15:33 CEST
| Matchup | Start CEST (ET) | Series | Away SP | Home SP | Stakes |
|---|---|---|---|---|---|
| TB 98-64 @ CLE 85-77 | 19:00 ● (1:00 p.m.) | ALCS G3 of 7 tied 1-1 | Griffin Jax 3.53 · 3.76 · 17.6% · 112.1 | Gavin Williams 3.76 · 3.47 · 25.1% · 184.1 | — |
| MIL 103-59 @ LAD 100-62 | Fri 02:00 (8:00 p.m.) | NLCS G4 of 7 MIL leads 3-0 | TBD | Tyler Glasnow 3.53 · 2.73 · 25.3% · 74.0 | MIL can clinch; LAD faces elimination |
Scoreboard
| Matchup | Final | Drama | Decisions | Links |
|---|---|---|---|---|
| MIL @ LAD | 6-2 | 2.84 ★★★ | W Hall · L Snell · S Megill | Box · Savant |
The Bracket
Wild Card Series (best of three, every game at the higher seed)
- AL: White Sox at Astros: White Sox win 2-0.
- AL: Red Sox at Yankees: Yankees win 2-0.
- NL: Phillies at Braves: Braves win 2-1.
- NL: Cubs at Padres: Padres win 2-0.
Division Series (best of five)
- AL: Yankees at Rays: Rays win 3-0.
- AL: White Sox at Guardians: Guardians win 3-2.
- NL: Padres at Brewers: Brewers win 3-1.
- NL: Braves at Dodgers: Dodgers win 3-1.
Championship Series (best of seven)
- AL: Guardians at Rays: Tied 1-1 · Game 3: Thu, Oct. 15, 19:00 CEST (1:00 p.m. ET) · history: tied 1-1, the team at home in Game 3 (Guardians) won 44 of 102.
- NL: Dodgers at Brewers: Brewers lead 3-0 · Game 4: Fri, Oct. 16, 02:00 CEST (8:00 p.m. ET) · history: up 3-0 in a best-of-seven, 41 of 42 won the series.
Game of the Night: Brewers 6, Dodgers 2
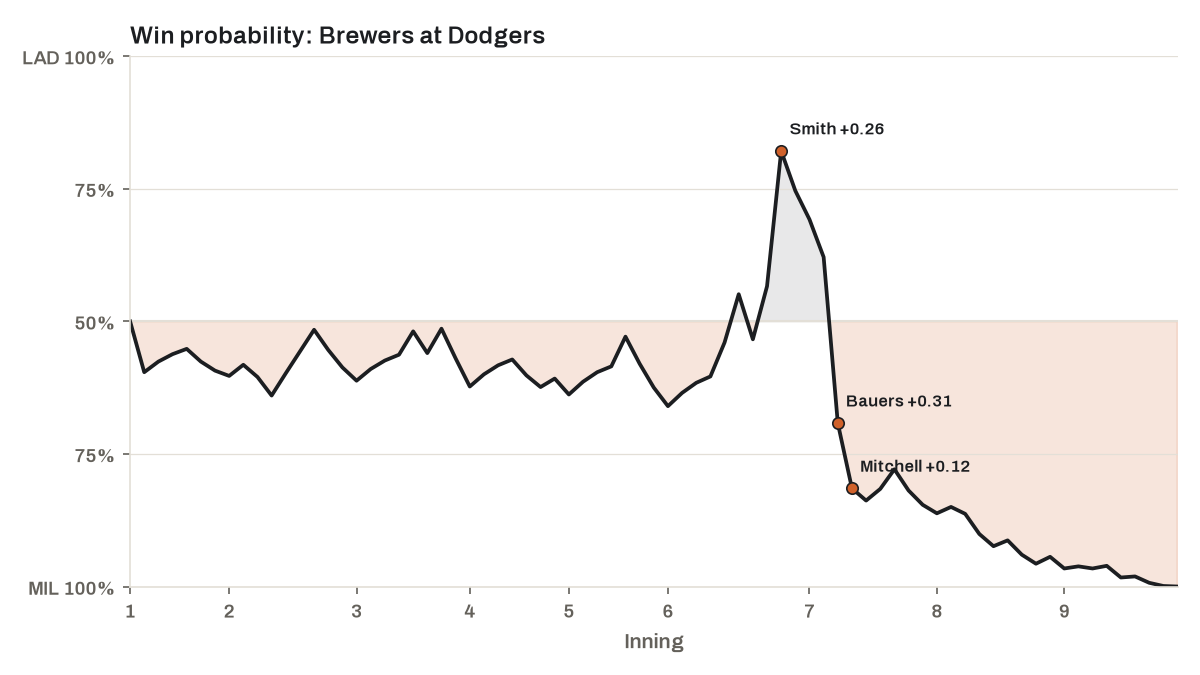
- Drama Index 2.84 ★★★ · 2 lead changes · peak leverage 4.08 (bottom 6th)
- In history: 633rd most dramatic of 1,878 postseason games since 1903 (Retrosheet)
- Top WPA: Robert Gasser +0.31 (pitcher) · Jake Bauers +0.26 (batter) · DL Hall +0.24 (pitcher)
- Bottom WPA: Abner Uribe -0.42 (pitcher) · Blake Snell -0.30 (pitcher) · Tommy Edman -0.15 (batter)
Watch: condensed game, 21 min · recap, 3 min (MLB.com)
| Inning | Matchup | Result | Win probability | WPA | LI |
|---|---|---|---|---|---|
| Top 7th | Jake Bauers vs. Blake Snell | Home Run | MIL 38% → 69% | +0.31 | 2.86 |
| Bot 6th | Will Smith vs. Abner Uribe | Double | LAD 57% → 82% | +0.26 | 4.08 |
| Top 7th | Garrett Mitchell vs. Blake Snell | Home Run | MIL 69% → 82% | +0.12 | 0.97 |
Top Performers
| Starter | Game | IP | H | R (ER) | BB | K | Pitches | GSc |
|---|---|---|---|---|---|---|---|---|
| Robert Gasser | MIL @ LAD | 5.0 | 3 | 0 | 1 | 3 | 72 | 65 |
| Blake Snell | LAD vs. MIL | 6.0 | 4 | 4 | 2 | 9 | 101 | 43 |
| Batter | Team | Line | WPA |
|---|---|---|---|
| Jake Bauers | MIL | 1-for-4, HR, 2 RBI | +0.26 |
| Will Smith | LAD | 1-for-4, 2B, 2 RBI | +0.18 |
| Garrett Mitchell | MIL | 1-for-3, HR, 1 RBI, BB | +0.13 |
| Miguel Rojas | LAD | 1-for-1, BB | +0.10 |
| Shohei Ohtani | LAD | 1-for-2, BB | +0.10 |
Statcast Corner
| Category | Player | Detail | Where |
|---|---|---|---|
| Hardest-hit ball | Shohei Ohtani (LAD) | 113.5 mph (183 km/h) single off DL Hall | MIL @ LAD, bot 8 |
| Longest home run | Garrett Mitchell (MIL) | 428 ft (130 m), 111.5 mph (179 km/h) | MIL @ LAD, top 7 |
| Fastest pitch | Roki Sasaki (LAD) | 100.7 mph (162 km/h) four-seamer to Brice Turang | MIL @ LAD, top 8 |
| Unluckiest out | Luis Lara (MIL) | line drive out, xBA .766, 86.9 mph (140 km/h), caught by RF Kyle Tucker | MIL @ LAD, top 9 |
Stat Lab · Lesson 21: Replacement level: below average can still be valuable
Kyle Tucker had one hit in four plate appearances in a 6-2 Dodgers loss to the Brewers last night. Over 627 plate appearances this season, he has been 10.1 runs worse than an average player. Yet his WAR is 0.9, above zero. Both are right; the difference is replacement level.
The idea. Replacement level is what a club can get for almost nothing: a minor league call-up or a waiver claim. It, not the average player, is WAR’s zero. FanGraphs and Baseball-Reference share a common replacement level, set so that all of MLB earns 1,000 WAR in a season. The 30 clubs win 2,430 games between them; take away 1,000 and divide by 30, and a team of replacement players wins about 48. The gap between average and replacement is paid as a playing-time credit: the more a player plays, the more he earns just by keeping a replacement off the field.
The math. Runs above average: batting +0.1, baserunning +0.2, fielding −5.0, positional −6.7, league +1.3, a total of −10.1. Add the replacement credit for his 627 plate appearances: −10.1 + 19.1 = 9.0 runs above replacement. Divide by the runs a win costs: 9.0 ÷ 9.82 = 0.9 WAR. That 9.82 is one league-wide figure, and the standings give an independent check: fit a line through every club’s run differential and record, and each extra win costs 10.8 runs. Both routes land near ten.
The scale. On the rough WAR scale, 0 is replacement, about 2 a solid regular and 5 an All-Star. An average player sits near 2 over a full season from the replacement credit alone: for Kyle Tucker it comes to 18.3 runs per 600 plate appearances, or 1.9 wins. He could have been 19.1 runs below average, not 10.1, before his WAR hit zero. He has company: 40 of the 156 hitters with 450-plus plate appearances are below average but above replacement.
What it doesn’t tell you:
- Replacement level is a convention, not a measurement. Move the line and every WAR moves with it, most for the players who play the most.
- WAR mixes quality and quantity: a below-average regular can out-WAR a better part-timer just by playing more.
- Above replacement is not the same as good enough. An average player in his 627 plate appearances would have added 1.0 more wins.
Try it. On a WAR leaderboard, pick a regular between 0 and 2 WAR whom you think of as a weak link. Who would replace him, and would that player be better?
Go deeper: FanGraphs Library: replacement level · MLB Glossary: WAR · FanGraphs Library: fWAR and rWAR
Check yourself
- Q1. What is Kyle Tucker’s WAR if you measure from average instead of replacement?
- Q2. If all of MLB shares 1,000 WAR a season, how many games would a team of replacement players win?
- Q3. About how many runs buy one extra win?
Show answers
- A1. −1.0 wins: −10.1 runs ÷ 9.82 runs per win.
- A2. About 48: the 30 clubs win 2,430 games in all; take away 1,000 and divide by 30.
- A3. About ten. This season WAR uses 9.82, and run differential against the standings gives 10.8.
Transaction Wire
- Braves: outrighted SS Luke Williams to Gwinnett Stripers · MLB Trade Rumors
Around the World
- KBO (Korea): Bears 1, Twins 4 (Wild Card)
- Venezuelan Winter League: Leones 9, Aguilas 4 · Tigres 0, Caribes 9 (shutout) · Bravos 3, Cardenales 4 (walk-off)
- Mexican Pacific League: Obregon 11, Navojoa 5 · Guasave 2, Los Mochis 0 (shutout) · Culiacan 4, Mazatlan 3 · Hermosillo 3, Mexicali 0 (shutout)
- Arizona Fall League: Rafters 3, Solar Sox 7 · Javelinas 8, Saguaros 9
Around the Web
Last Night’s Games
- Brewers 6, Dodgers 2 — Bauers refuses to give up – not on his career, not against a pair of Dodgers aces (MLB.com)
News
- Brewers-Dodgers NLCS Game 4 FAQ (8 ET, FS1/FOX One) — MLB.com
- Rays, Guardians to play ALCS Game 3 in afternoon with rain forecast Thursday night — AP via NBC Sports
- Phillies keep Don Mattingly as manager, extend his contract through 2028 season — CBS Sports
- Phillies fire hitting coach Kevin Long, infield coach Bobby Dickerson: Sources — The Athletic (subscription)
Transactions & Rumors
- Phillies Sign Don Mattingly To Two-Year Deal — MLB Trade Rumors
- White Sox To Pursue Starting Pitching — MLB Trade Rumors
Analysis · Listen (7)
Analysis
- This Is Why Kevin Cash Pulled Blake Snell — FanGraphs
- Top 2026-2027 MLB Non-Tender Candidates — Just Baseball
- Brewers Beat Dodgers, Then Continue Beating Dodgers — Baseball Prospectus (subscription)
- Cup of Coffee: October 14, 2026 — Cup of Coffee (subscription)
Listen
- Crew closing in; Rays, Guards clash in Cleveland — MLB Morning Lineup · 12 min
- MOMENTUM SHIFT: Freddy Peralta and Tampa Bay Rays FORCE Tie — Locked On MLB · 32 min
- Effectively Wild Episode 2544: Just Wait Till Next Year — Effectively Wild · 101 min
Terms in This Post
Drama Index · Leverage Index (LI) · Win Probability Added (WPA) · Hard-Hit Rate (HardHit%) · Barrel · Replacement Level · every term in the Glossary
Sources & Notes
Built automatically from MLB Stats API, Baseball Savant and MyKBO Stats data; numbers through Oct. 14, 2026, with FIP, xFIP, WAR and wRC+ up to a day behind. Highlight videos link to MLB.com. The information used here was obtained free of charge from and is copyrighted by Retrosheet. Interested parties may contact Retrosheet at “www.retrosheet.org”. How this site works