
Mon, Oct. 12 · 2 games · Stat Lab #19: Regression to the mean: shrinking a batting average · 7-min read
Press time 18:10 CEST · Final 2/2 · Statcast: posted · Headlines: 1/19 feeds failed
- Last night: 2 final
- Game of the Night: Guardians 7, Rays 3 · Drama 3.01 ★★★★
- Championship Series: CLE-TB: Guardians lead 1-0 · LAD-MIL: Brewers lead 2-0
- Tonight: 1 game · first pitch Wed 02:00 CEST
- Stat Lab #19: Regression to the mean: shrinking a batting average
- Jump to: Glance · Tonight · Scoreboard · Bracket · Game of the Night · Watch · Performers · Statcast · Stat Lab · Wire · World · Web · Terms · Sources
Last Night at a Glance
- NL Championship Series Game 2: Dodgers 4, Brewers 7 · Brewers lead 2-0
- AL Championship Series Game 1: Guardians 7, Rays 3 · Guardians lead 1-0
Tonight (CEST)
Tue, Oct. 13 · 1 game · none before 23:00 CEST · starters as of 18:09 CEST
| Matchup | Start CEST (ET) | Series | Away SP | Home SP | Stakes |
|---|---|---|---|---|---|
| CLE 85-77 @ TB 98-64 | Wed 02:00 (8:00 p.m.) | ALCS G2 of 7 CLE leads 1-0 | Parker Messick 2.56 · 3.07 · 19.3% · 186.1 | Freddy Peralta 4.42 · 4.28 · 12.7% · 169.0 | — |
Scoreboard
| Matchup | Final | Drama | Decisions | Links |
|---|---|---|---|---|
| CLE @ TB | 7-3 | 3.01 ★★★★ | W Gaddis · L Wells | Box · Savant |
| LAD @ MIL | 4-7 | 2.60 ★★★ | W Romero · L Stewart · S Ashby | Box · Savant |
The Bracket
Wild Card Series (best of three, every game at the higher seed)
- AL: White Sox at Astros: White Sox win 2-0.
- AL: Red Sox at Yankees: Yankees win 2-0.
- NL: Phillies at Braves: Braves win 2-1.
- NL: Cubs at Padres: Padres win 2-0.
Division Series (best of five)
- AL: Yankees at Rays: Rays win 3-0.
- AL: White Sox at Guardians: Guardians win 3-2.
- NL: Padres at Brewers: Brewers win 3-1.
- NL: Braves at Dodgers: Dodgers win 3-1.
Championship Series (best of seven)
- AL: Guardians at Rays: Guardians lead 1-0 · Game 2: Wed, Oct. 14, 02:00 CEST (8:00 p.m. ET) · history: up 1-0 in a best-of-seven, 127 of 197 won the series.
- NL: Dodgers at Brewers: Brewers lead 2-0 · Game 3: Thu, Oct. 15, 02:00 CEST (8:00 p.m. ET) · history: up 2-0 in a best-of-seven, 79 of 95 won the series.
Game of the Night: Guardians 7, Rays 3
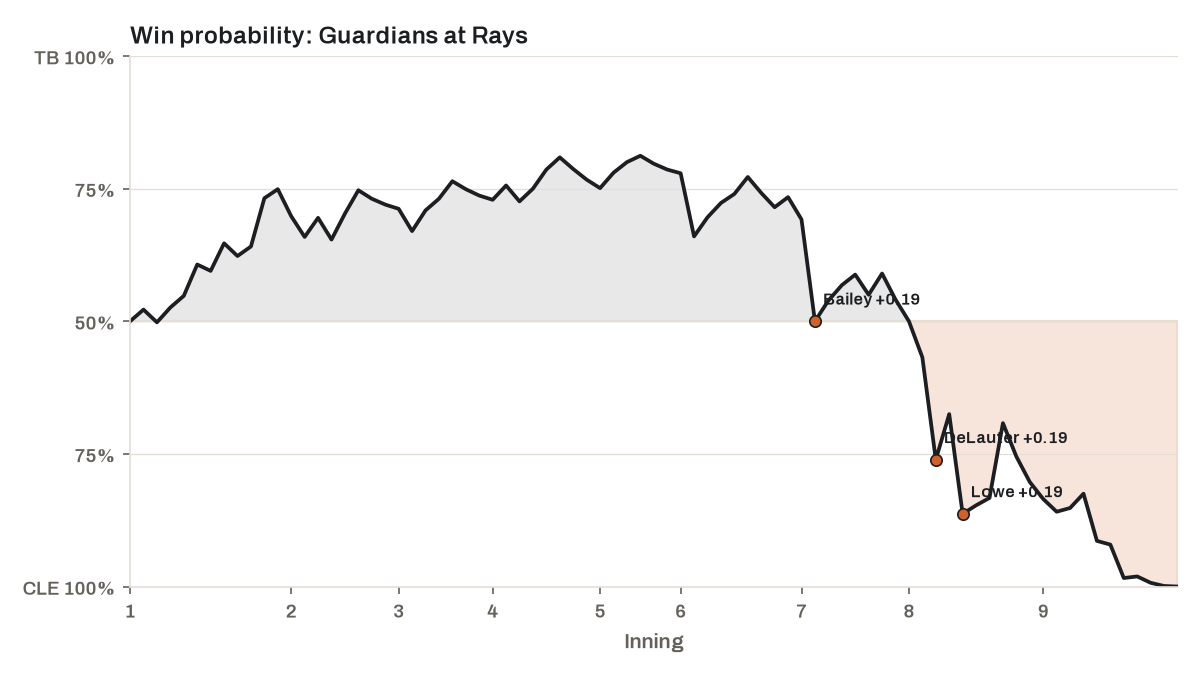
- Drama Index 3.01 ★★★★ · 1 lead change · Guardians came back from 2 down · peak leverage 3.46 (top 8th)
- In history: 574th most dramatic of 1,878 postseason games since 1903 (Retrosheet)
- Top WPA: Chase DeLauter +0.30 (batter) · Patrick Bailey +0.18 (batter) · Nathaniel Lowe +0.17 (batter)
- Bottom WPA: Tyler Wells -0.17 (pitcher) · Ian Seymour -0.16 (pitcher) · Brayan Rocchio -0.13 (batter)
Watch: condensed game, 25 min · recap, 3 min (MLB.com)
| Inning | Matchup | Result | Win probability | WPA | LI |
|---|---|---|---|---|---|
| Top 8th | Chase DeLauter vs. Tyler Wells | Double | CLE 57% → 76% | +0.19 | 2.83 |
| Top 7th | Patrick Bailey vs. Drew Rasmussen | Home Run | CLE 31% → 50% | +0.19 | 1.71 |
| Top 8th | Nathaniel Lowe vs. Ian Seymour | Single | CLE 68% → 86% | +0.19 | 3.46 |
Watch
- Dodgers 4, Brewers 7 · condensed game, 25 min (MLB.com)
Top Performers
| Starter | Game | IP | H | R (ER) | BB | K | Pitches | GSc |
|---|---|---|---|---|---|---|---|---|
| Foster Griffin | CLE @ TB | 4.0 | 5 | 2 | 0 | 3 | 63 | 51 |
| Drew Rasmussen | TB vs. CLE | 6.0 | 8 | 2 | 0 | 7 | 91 | 49 |
| Logan Henderson | MIL vs. LAD | 4.0 | 3 | 4 (2) | 2 | 2 | 64 | 44 |
| Yoshinobu Yamamoto | LAD @ MIL | 2.2 | 4 | 3 | 2 | 1 | 75 | 36 |
| Batter | Team | Line | WPA |
|---|---|---|---|
| Chase DeLauter | CLE | 3-for-4, HR, 2B, 1 RBI, BB | +0.30 |
| William Contreras | MIL | 3-for-4, HR, 3 RBI, BB | +0.29 |
| Patrick Bailey | CLE | 2-for-4, HR, 1 RBI | +0.18 |
| Nathaniel Lowe | CLE | 2-for-5, 2 RBI | +0.17 |
| Tommy Edman | LAD | 1-for-2 | +0.15 |
Statcast Corner
| Category | Player | Detail | Where |
|---|---|---|---|
| Fastest pitch | Edgardo Henriquez (LAD) | 103.4 mph (166 km/h) sinker to Jackson Chourio | LAD @ MIL, bot 8 |
| Hardest-hit ball | Yandy Díaz (TB) | 114.6 mph (184 km/h) double off Foster Griffin | CLE @ TB, bot 1 |
| Unluckiest out | Freddie Freeman (LAD) | fly ball out, xBA .843, 106.4 mph (171 km/h), caught by RF Sal Frelick | LAD @ MIL, top 3 |
| Longest home run | William Contreras (MIL) | 436 ft (133 m), 106.3 mph (171 km/h) | LAD @ MIL, bot 5 |
Stat Lab · Lesson 19: Regression to the mean: shrinking a batting average
Chandler Simpson of the Rays went hitless in one plate appearance last night in a 7-3 Rays loss to the Guardians. His season batting average is .306, .062 above the league’s .244. Is he really that good? Probably not quite. Regression to the mean says how far to pull the number back toward the middle.
The idea. Regression to the mean is why extreme numbers drift back toward average. An extreme result is usually part talent and part luck, and only the talent repeats. A batting average is noisy: ten bloopers that drop, or ten line drives that find a glove, move a season’s average by nearly 20 points. So the honest estimate of a hitter’s true average sits between what he did and the league average. The simple fix: add a fixed number of league-average at-bats, k, to every hitter’s line. The smaller his sample, the harder they pull.
The math. Take the 176 hitters with 400-plus at-bats. Their averages spread with a standard deviation of .026. Chance alone, at their at-bats and the league’s .244, would produce .019; what is left, .018, is the spread of true talent (spreads add as squares: .019² + .018² ≈ .026²). So luck explains about 53% of the variance. That sets k = 591, the number of at-bats at which luck and talent spread averages equally. Add 591 league-average at-bats, or 591 × .244 = 144.2 hits, to his line: (175 + 144.2) ÷ (571 + 591) = 319.2 ÷ 1,162 = .275. He keeps 571 ÷ 1,162 = 49% of his distance from the mean.
The scale. Talent in batting average is tightly packed: one talent spread above the league is a true .262 hitter, two spreads .280, and two below .208. An average needs about 591 at-bats before skill outweighs luck, more than Chandler Simpson had all season. His estimate, .275, is still .031 above average: a very good hitter, just not a .306 one.
What it doesn’t tell you:
- It is a talent estimate, not a forecast. Next month brings its own luck: over 100 at-bats, chance alone gives a .244 hitter a typical swing of .043.
- His own past seasons are better evidence than the league average; projection systems use them.
- His xBA, based on how hard and at what angle he hit the ball, is .258: evidence this shrink ignores. Most of the luck lives in BABIP, his average on balls in play.
Try it. Take a hot April: 30 hits in 80 at-bats, a .375 average. Add 591 league-average at-bats: (30 + 144.2) ÷ (80 + 591) = .260. Do the same the next time a hitter starts hot.
Go deeper: FanGraphs Library: regression · FanGraphs Library: sample size · MLB Glossary: xBA
Check yourself
- Q1. A hitter has 20 hits in 50 at-bats, a .400 average. With k = 591 and a .244 league average, what is his regressed average?
- Q2. What does k = 591 mean in plain words?
- Q3. Is regression to the mean a force that pulls players back?
Show answers
- A1. (20 + 144.2) ÷ (50 + 591) = 164.2 ÷ 641 = .256. Fifty at-bats barely move the estimate off the league average.
- A2. After 591 at-bats, luck and talent contribute equally to the spread of batting averages. Below that, luck dominates; above it, skill does.
- A3. No. Extreme results tend to include extreme luck, and luck doesn’t repeat, so the next sample usually lands closer to the player’s true level.
Transaction Wire
- Guardians: status change for RHP Slade Cecconi
- Guardians: status change for CF Daniel Schneemann
More moves (2)
- Rays: status change for LHP Garrett Cleavinger
- Rays: status change for RHP Brody Hopkins
Around the World
- KBO (Korea): Twins 2, Tigers 4 · Giants 7, Bears 4 · Wiz 4, Lions 2
- CPBL (Taiwan): Lions 2, Brothers 8 (Challenge Series Game 4)
- Venezuelan Winter League: Tiburones 10, Navegantes 6
- Arizona Fall League: Desert Dogs 2, Scorpions 6
Around the Web
Last Night’s Games
- Guardians 7, Rays 3 — Guardians-Rays ALCS Game 2 FAQ (8 ET, TBS/HBO Max) (MLB.com)
- Dodgers 4, Brewers 7 — ‘Wild Bill’ takes charge for Brewers with 3 hits, 3 RBIs — and 0 worries about next contract (MLB.com)
News
- ‘Hosey’ does it: Ramírez’s havoc on basepaths key to Guards’ 4th straight win — MLB.com
- Hitters are winning more ABS challenges in the postseason, and teams are challenging more overall — AP via NBC Sports
- 2026 MLB playoff bracket: Schedule, scores for Brewers vs. Dodgers and Rays vs. Guardians — CBS Sports
- Cleveland’s hitters keep proving they belong, this time in taking Game 1 from Tampa Bay — The Athletic (subscription)
Transactions & Rumors
- Dodgers To Consider Benching Ohtani In Game 3 — MLB Trade Rumors
- The Rays can thank the Guardians for their biggest star: How a ‘bad trade’ sent Junior Caminero to Tampa — CBS Sports
- The Tigers’ Under-The-Radar Option Decision — MLB Trade Rumors
Analysis · Listen (7)
Analysis
- Guardians Erase Another 2-0 Deficit, Take Game 1 of ALCS From Rays — FanGraphs
- What’s Next for Division Series Losers? — Pitcher List
- NLCS Game 2 Preview: Dodgers vs. Brewers — Baseball Prospectus (subscription)
- Cup of Coffee: October 12, 2026 — Cup of Coffee (subscription)
Listen
- Guards, Brewers just can’t stop winning — MLB Morning Lineup · 13 min
- DIFFERENCE MAKERS: Luis Lara Milwaukee Brewers OUTPLAY Champion Dodgers — Locked On MLB · 30 min
- Brewers take Game 1 from Dodgers, Rays-Guardians ALCS preview & White Sox season recap — Baseball Bar-B-Cast · 60 min
Terms in This Post
Drama Index · Leverage Index (LI) · Win Probability Added (WPA) · Hard-Hit Rate (HardHit%) · Barrel · Regression to the Mean · every term in the Glossary
Sources & Notes
Built automatically from MLB Stats API, Baseball Savant, MyKBO Stats and CPBL Stats data; numbers through Oct. 12, 2026, with FIP, xFIP, WAR and wRC+ up to a day behind. Highlight videos link to MLB.com. The information used here was obtained free of charge from and is copyrighted by Retrosheet. Interested parties may contact Retrosheet at “www.retrosheet.org”. How this site works