
Sun, Oct. 11 · 1 game · Stat Lab #18: xFIP and home-run luck · 7-min read
Press time 13:07 CEST · Final 1/1 · Statcast: posted
- Last night: 1 final
- Game of the Night: Dodgers 1, Brewers 2 · Drama 2.90 ★★★
- Championship Series: CLE-TB: Not started · LAD-MIL: Brewers lead 1-0
- Tonight: 2 games · first pitch 23:00 CEST
- Stat Lab #18: xFIP and home-run luck
- Jump to: Glance · Tonight · Scoreboard · Bracket · Game of the Night · Performers · Statcast · Stat Lab · Wire · World · Web · Terms · Sources
Last Night at a Glance
- NL Championship Series Game 1: Dodgers 1, Brewers 2 · Brewers lead 1-0
Tonight (CEST)
Mon, Oct. 12 · 2 games · none before 23:00 CEST · starters as of 13:07 CEST
| Matchup | Start CEST (ET) | Series | Away SP | Home SP | Stakes |
|---|---|---|---|---|---|
| LAD 100-62 @ MIL 103-59 | 23:00 (5:00 p.m.) | NLCS G2 of 7 MIL leads 1-0 | Yoshinobu Yamamoto 2.53 · 3.33 · 19.8% · 185.0 | Logan Henderson 2.47 · 3.32 · 24.5% · 98.1 | — |
| CLE 85-77 @ TB 98-64 | Tue 02:00 (8:00 p.m.) | ALCS G1 of 7 | Foster Griffin 3.60 · 3.96 · 15.7% · 172.2 | Drew Rasmussen 2.67 · 2.82 · 21.2% · 172.0 | — |
Scoreboard
| Matchup | Final | Drama | Decisions | Links |
|---|---|---|---|---|
| LAD @ MIL | 1-2 | 2.90 ★★★ | W Hall · L Skubal · S Megill | Box · Savant |
The Bracket
Wild Card Series (best of three, every game at the higher seed)
- AL: White Sox at Astros: White Sox win 2-0.
- AL: Red Sox at Yankees: Yankees win 2-0.
- NL: Phillies at Braves: Braves win 2-1.
- NL: Cubs at Padres: Padres win 2-0.
Division Series (best of five)
- AL: Yankees at Rays: Rays win 3-0.
- AL: White Sox at Guardians: Guardians win 3-2.
- NL: Padres at Brewers: Brewers win 3-1.
- NL: Braves at Dodgers: Dodgers win 3-1.
Championship Series (best of seven)
- AL: Guardians at Rays: Not started · Game 1: Tue, Oct. 13, 02:00 CEST (8:00 p.m. ET).
- NL: Dodgers at Brewers: Brewers lead 1-0 · Game 2: Mon, Oct. 12, 23:00 CEST (5:00 p.m. ET) · history: up 1-0 in a best-of-seven, 127 of 197 won the series.
Game of the Night: Dodgers 1, Brewers 2
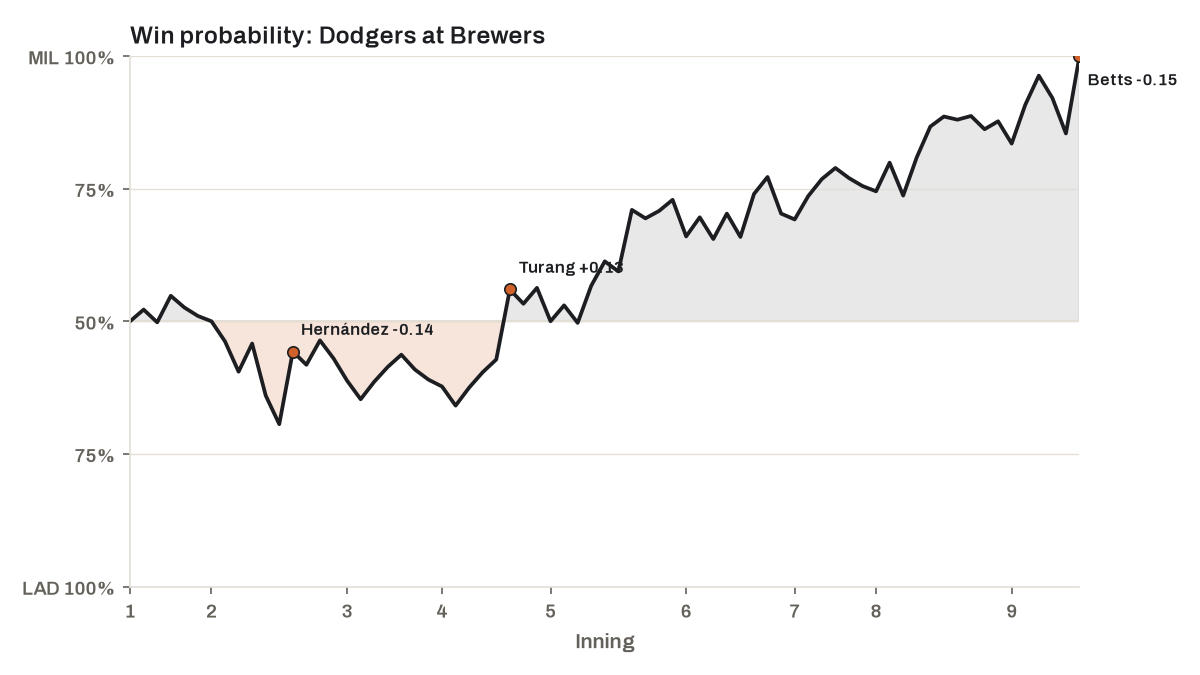
- Drama Index 2.90 ★★★ · 1 lead change · peak leverage 5.77 (top 9th)
- In history: 617th most dramatic of 1,878 postseason games since 1903 (Retrosheet)
- Top WPA: Aaron Ashby +0.22 (pitcher) · Trevor Megill +0.17 (pitcher) · Brice Turang +0.13 (batter)
- Bottom WPA: Enrique Hernández -0.20 (batter) · Freddie Freeman -0.13 (batter) · Mookie Betts -0.12 (batter)
Watch: condensed game, 23 min · recap, 3 min (MLB.com)
| Inning | Matchup | Result | Win probability | WPA | LI |
|---|---|---|---|---|---|
| Top 9th | Mookie Betts vs. Trevor Megill | Flyout | LAD 15% → 0% | -0.15 | 5.77 |
| Top 2nd | Enrique Hernández vs. Jacob Misiorowski | Grounded Into DP | LAD 69% → 56% | -0.14 | 2.18 |
| Bot 4th | Brice Turang vs. Tarik Skubal | Home Run | MIL 43% → 56% | +0.13 | 1.18 |
Top Performers
| Starter | Game | IP | H | R (ER) | BB | K | Pitches | GSc |
|---|---|---|---|---|---|---|---|---|
| Jacob Misiorowski | MIL vs. LAD | 4.1 | 5 | 1 | 3 | 5 | 94 | 52 |
| Tarik Skubal | LAD @ MIL | 5.0 | 5 | 2 | 2 | 7 | 81 | 51 |
| Batter | Team | Line | WPA |
|---|---|---|---|
| Brice Turang | MIL | 1-for-2, HR, 1 RBI, BB | +0.13 |
| Luis Lara | MIL | 1-for-3, 1 RBI | +0.07 |
| Josue De Paula | LAD | 0-for-0, BB | +0.07 |
| Kyle Tucker | LAD | 0-for-2, 2 BB | +0.04 |
| Jake Bauers | MIL | 1-for-3, BB | +0.01 |
Statcast Corner
| Category | Player | Detail | Where |
|---|---|---|---|
| Fastest pitch | Jacob Misiorowski (MIL) | 104.0 mph (167 km/h) four-seamer to Freddie Freeman | LAD @ MIL, top 1 |
| Hardest-hit ball | Max Muncy (LAD) | 106.7 mph (172 km/h) single off Abner Uribe | LAD @ MIL, top 6 |
| Longest home run | Brice Turang (MIL) | 384 ft (117 m), 102.5 mph (165 km/h) | LAD @ MIL, bot 4 |
| Unluckiest out | Garrett Mitchell (MIL) | grounder out, xBA .511, 106.3 mph (171 km/h), caught by SS Mookie Betts | LAD @ MIL, bot 8 |
Stat Lab · Lesson 18: xFIP and home-run luck
Trevor Megill faced five batters in a 2-1 Brewers win over the Dodgers last night. This season he has allowed 1 home run in 61 2/3 innings. A formula built to ignore luck on fly balls says a typical pitcher with his fly balls would have allowed about 8.6. That 7.6-homer gap is the whole story of two famous pitching stats disagreeing.
The idea. xFIP starts from FIP’s idea, counting only the outcomes no fielder touches, and goes one step further: it keeps the strikeouts and walks but swaps the pitcher’s real home runs for the number a league-average pitcher would allow on the same fly balls. The reason is stability. Strikeout and walk rates settle within a few hundred batters, but home runs per fly ball bounce around for years, pushed by wind, parks and a few feet of warning track, so xFIP treats the difference as noise.
The math. The formulas differ only in the home-run term: 13 × HR in FIP, 13 × (fly balls × league HR/FB) in xFIP. So xFIP − FIP = 13 × (expected HR − HR) ÷ IP, and expected HR = HR + (xFIP − FIP) × IP ÷ 13 = 1 + (3.45 − 1.85) × 61.67 ÷ 13 = 8.6. Each homer is worth 13 ÷ 61.67 = 0.211 runs of FIP for him, so the 7.6 missing homers explain the gap: 0.211 × 7.6 ≈ 1.60. Per nine innings: 0.15 real home runs, 1.26 expected.
The scale. Among the 464 pitchers with 30-plus innings, 62% have a FIP and an xFIP within half a run of each other; Trevor Megill’s 1.60 is the ninth-widest. When FIP sits this far below xFIP, the bet is that more of his fly balls start leaving the park and his ERA (2.63) creeps up.
What it doesn’t tell you:
- Some pitchers really do allow fewer homers per fly ball (elite velocity, pitches hitters pop up), and some home parks really do allow more. xFIP flattens them all to the league rate, so it can be wrong about the same pitcher for years.
- Even 61 2/3 innings is a small sample for home runs per fly ball.
- Fly balls themselves are partly a skill: a ground-ball pitcher allows fewer of them, and xFIP does credit him for that. Only the rate per fly ball is treated as luck.
Try it. Pick a pitcher from tonight’s box scores, look up his FIP and xFIP, and back out the homers xFIP expects: HR + (xFIP − FIP) × IP ÷ 13. Does his real total run ahead of the expected one, like Trevor Megill’s 1 against 8.6, or behind it?
Go deeper: MLB Glossary: xFIP · FanGraphs Library: xFIP · FanGraphs Library: SIERA
Check yourself
- Q1. Why does xFIP replace home runs but keep strikeouts and walks exactly as they happened?
- Q2. If Trevor Megill had allowed one fewer home run, how much lower would his FIP be? And his xFIP?
- Q3. A pitcher has a FIP of 4.00 and an xFIP of 4.00. What does that say about his home runs?
Show answers
- A1. Strikeout and walk rates settle quickly and repeat from year to year, while home runs per fly ball swing widely even for the same pitcher. xFIP keeps the parts that repeat and averages out the part that mostly doesn’t.
- A2. FIP: 13 ÷ 61.67 = 0.211 runs lower. xFIP: unchanged, because it never used his real home-run total.
- A3. He has allowed almost exactly the homers a league-average rate on his fly balls predicts; there is no home-run luck to correct.
Transaction Wire
- Dodgers: status change for LHP Justin Wrobleski (1.9 WAR this season)
- Dodgers: status change for SS Hyeseong Kim
Around the World
- KBO (Korea): Wiz 12, Lions 3 · Giants 4, Tigers 1
- CPBL (Taiwan): Lions 4, Brothers 2 (Challenge Series Game 3)
- Arizona Fall League: Desert Dogs 4, Saguaros 5 (walk-off)
Around the Web
Last Night’s Games
- Dodgers 1, Brewers 2 — Brewers take Game 1 in NLCS rematch against defending champs (MLB.com)
News
- Without best stuff, Miz grinds into the 5th, then Crew’s lockdown ‘pen takes over — MLB.com
- Shane McClanahan will not pitch for the Tampa Bay Rays in the postseason — AP via NBC Sports
- Pros and cons of MLB proposal: 154-game season, longer LDS could be great, but deal has built-in roadblock — CBS Sports
- Vladimir Guerrero Jr. reportedly undergoes laser eye surgery after career-worst season — The Athletic (subscription)
Transactions & Rumors
- Alex Anthopoulos Discusses Braves’ Free Agents, Rotation, Profar — MLB Trade Rumors
- Each Team’s Penalty For Signing A Qualifying Offer-Rejecting Free Agent — MLB Trade Rumors
Analysis · Listen (7)
Analysis
- It’s Brewtal Out There: Milwaukee Takes Game 1 — FanGraphs
- Why Carson Benge Should Win the NL Rookie of the Year — Just Baseball
- MLB Division Series News & Moments: Guardians End White Sox’s Run — Pitcher List
- ALCS Series Preview: Rays vs Guardians — Baseball Prospectus (subscription)
Listen
- Brewers land first punch in NLCS rematch — MLB Morning Lineup · 11 min
- JOSE RAMIREZ LEADS CLEVELAND – White Sox Strike Out an Eye Popping 21 Times — Locked On MLB · 34 min
- Guardians vs. Rays ALCS Preview: Can Cleveland’s Pitching Go the Distance? — Rates & Barrels · 54 min
Terms in This Post
Drama Index · Leverage Index (LI) · Win Probability Added (WPA) · Hard-Hit Rate (HardHit%) · Barrel · every term in the Glossary
Sources & Notes
Built automatically from MLB Stats API, Baseball Savant, MyKBO Stats and CPBL Stats data; numbers through Oct. 11, 2026, with FIP, xFIP, WAR and wRC+ up to a day behind. Highlight videos link to MLB.com. The information used here was obtained free of charge from and is copyrighted by Retrosheet. Interested parties may contact Retrosheet at “www.retrosheet.org”. How this site works