
Sat, Oct. 10 · 1 game · Stat Lab #17: Strikeout and walk rates: the plate-discipline stats · 7-min read
Press time 16:36 CEST · Final 1/1 · Statcast: posted
- Last night: 1 final
- Game of the Night: White Sox 0, Guardians 2 · Drama 1.67 ★★
- Championship Series: CLE-TB: Not started · LAD-MIL: Not started
- Tonight: 1 game · first pitch Mon 02:00 CEST
- Stat Lab #17: Strikeout and walk rates: the plate-discipline stats
- Jump to: Glance · Tonight · Scoreboard · Bracket · Game of the Night · Performers · Statcast · Stat Lab · World · Web · Terms · Sources
Last Night at a Glance
- AL Division Series Game 5: White Sox 0, Guardians 2 · Guardians win 3-2
- 10+ strikeouts: Gavin Williams (CLE) 12 K
- Shutouts: White Sox 0, Guardians 2
Tonight (CEST)
Sun, Oct. 11 · 1 game · none before 23:00 CEST · starters as of 16:36 CEST
| Matchup | Start CEST (ET) | Series | Away SP | Home SP | Stakes |
|---|---|---|---|---|---|
| LAD 100-62 @ MIL 103-59 | Mon 02:00 (8:00 p.m.) | NLCS G1 of 7 | Tarik Skubal 2.72 · 2.51 · 25.6% · 158.2 | Jacob Misiorowski 1.80 · 2.17 · 31.3% · 174.2 | — |
Scoreboard
| Matchup | Final | Drama | Decisions | Links |
|---|---|---|---|---|
| CWS @ CLE | 0-2 | 1.67 ★★ | W Williams · L Burke · S Smith | Box · Savant |
The Bracket
Wild Card Series (best of three, every game at the higher seed)
- AL: White Sox at Astros: White Sox win 2-0.
- AL: Red Sox at Yankees: Yankees win 2-0.
- NL: Phillies at Braves: Braves win 2-1.
- NL: Cubs at Padres: Padres win 2-0.
Division Series (best of five)
- AL: Yankees at Rays: Rays win 3-0.
- AL: White Sox at Guardians: Guardians win 3-2.
- NL: Padres at Brewers: Brewers win 3-1.
- NL: Braves at Dodgers: Dodgers win 3-1.
Championship Series (best of seven)
- AL: Guardians at Rays: Not started · Game 1: Tue, Oct. 13, 02:00 CEST (8:00 p.m. ET).
- NL: Dodgers at Brewers: Not started · Game 1: Mon, Oct. 12, 02:00 CEST (8:00 p.m. ET).
Game of the Night: White Sox 0, Guardians 2
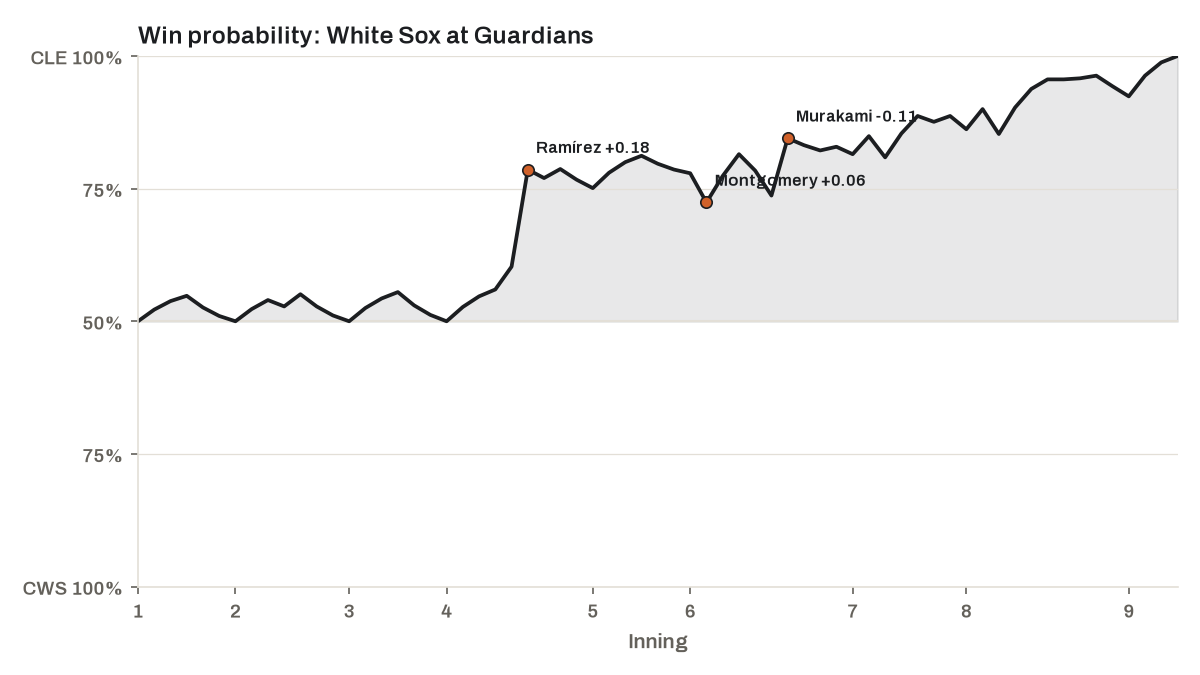
- Drama Index 1.67 ★★ · 0 lead changes · peak leverage 4.20 (top 6th)
- In history: 1,570th most dramatic of 1,878 postseason games since 1903 (Retrosheet)
- Top WPA: Gavin Williams +0.23 (pitcher) · José Ramírez +0.16 (batter) · Cade Smith +0.16 (pitcher)
- Bottom WPA: Munetaka Murakami -0.18 (batter) · Andrew Benintendi -0.10 (batter) · Chase Meidroth -0.08 (batter)
Watch: condensed game, 19 min · recap, 3 min (MLB.com)
| Inning | Matchup | Result | Win probability | WPA | LI |
|---|---|---|---|---|---|
| Bot 4th | José Ramírez vs. Sean Burke | Home Run | CLE 60% → 79% | +0.18 | 1.74 |
| Top 6th | Munetaka Murakami vs. Erik Sabrowski | Strikeout | CWS 26% → 16% | -0.11 | 4.20 |
| Top 6th | Colson Montgomery vs. Gavin Williams | Hit By Pitch | CWS 22% → 28% | +0.06 | 1.23 |
Top Performers
| Starter | Game | IP | H | R (ER) | BB | K | Pitches | GSc |
|---|---|---|---|---|---|---|---|---|
| Gavin Williams | CLE vs. CWS | 5.2 | 1 | 0 | 2 | 12 | 94 | 80 |
| Sean Burke | CWS @ CLE | 5.0 | 4 | 2 | 0 | 4 | 71 | 54 |
| Batter | Team | Line | WPA |
|---|---|---|---|
| José Ramírez | CLE | 1-for-3, HR, 2 RBI, BB | +0.16 |
| Tristan Peters | CWS | 1-for-3, BB | +0.02 |
| Steven Kwan | CLE | 1-for-3, BB | +0.01 |
Statcast Corner
| Category | Player | Detail | Where |
|---|---|---|---|
| Unluckiest out | Chase DeLauter (CLE) | line drive out, xBA .809, 109.2 mph (176 km/h), caught by CF Brenton Doyle | CWS @ CLE, bot 1 |
| Fastest pitch | Gavin Williams (CLE) | 100.8 mph (162 km/h) four-seamer to Munetaka Murakami | CWS @ CLE, top 4 |
| Hardest-hit ball | Chase DeLauter (CLE) | 110.2 mph (177 km/h) single off Sean Newcomb | CWS @ CLE, bot 6 |
| Longest home run | José Ramírez (CLE) | 348 ft (106 m), 97.2 mph (156 km/h) | CWS @ CLE, bot 4 |
Stat Lab · Lesson 17: Strikeout and walk rates: the plate-discipline stats
Steven Kwan of the Guardians has 85 walks and 62 strikeouts in 637 plate appearances this season. The average hitter strikes out about two and a half times as often as he walks, so walking more often than striking out is rare. Last night he struck out once in four trips to the plate, during a 2-0 Guardians win over the White Sox. Two simple rates show what that means.
The idea. Strikeout rate (K%) is strikeouts divided by plate appearances. Walk rate (BB%) is walks divided by plate appearances; here walks include intentional walks. Both use plate appearances, not at-bats: a walk is not an at-bat, so dividing by at-bats would leave out the very trips that ended in walks. The two rates describe the duel between pitcher and hitter before any fielder gets involved. Does he chase bad pitches? Can he make contact? Will he take ball four? Walks also feed his on-base percentage. And the rates settle quickly: they say something real after a month or two, while batting average needs most of a season.
The math. K%: 62 strikeouts ÷ 637 plate appearances = 9.7%. BB%: 85 walks ÷ 637 = 13.3%. One way to combine them is walk rate minus strikeout rate: 13.3 − 9.7 = +3.6 percentage points for him, 8.9 − 22.1 = −13.2 for the league. He is 16.8 points better than average. Over 600 plate appearances, his strikeout rate means about 58 strikeouts; the league’s means about 133.
The scale. This season the league strikes out in 22.1% of plate appearances and walks in 8.9%. Among the 267 hitters with 300-plus plate appearances, strikeout rates run from 4.3% to 37.3%. Steven Kwan’s 85 walks against 62 strikeouts put him far on the disciplined side of the league’s balance, and he sees 4.11 pitches per plate appearance.
What it doesn’t tell you:
- A low strikeout rate can mean contact rather than patience. A hitter who swings at nearly everything and puts it in play rarely strikes out, but he rarely walks either.
- Intentional walks count here, and they reflect how much pitchers fear a hitter, not his eye.
- Neither rate says what happens when he connects. For that, check his power (ISO: .067 for him) and his batting average (.282).
- Fast is not instant. A week of plate appearances is still noise, even for these rates; mind the sample size.
Try it. Pick one hitter in tonight’s game and log every plate appearance as a strikeout, a walk or a ball in play. Then open a leaderboard with K% and BB% and find the hitters with more walks than strikeouts.
Go deeper: MLB Glossary: strikeout rate · MLB Glossary: walk rate · FanGraphs Library: sample size
Check yourself
- Q1. Steven Kwan has 62 strikeouts and 85 walks in 637 plate appearances. What are his K% and BB%?
- Q2. Why are these rates divided by plate appearances rather than at-bats?
- Q3. After a month of games, which tells you more about a hitter: his strikeout rate or his batting average?
Show answers
- A1. 9.7% and 13.3%: each count divided by 637 plate appearances.
- A2. A walk is not an at-bat. Dividing by at-bats would drop the plate appearances that ended in walks and make both rates look bigger than they are.
- A3. His strikeout rate. It says something real within a month or two; batting average needs most of a season.
Around the World
- KBO (Korea): Twins 4, Giants 3 (10) · Landers 5, Tigers 8 · Dinos 9, Eagles 8
- CPBL (Taiwan): Brothers 0, Lions 1 (Challenge Series Game 2, shutout)
- Arizona Fall League: Javelinas 3, Solar Sox 7 · Scorpions 10, Rafters 2
Around the Web
Last Night’s Games
- White Sox 0, Guardians 2 — Guardians erase 0-2 hole, complete ALDS comeback to punch ALCS ticket (MLB.com)
News
- Guardians-Rays ALCS Game 1 FAQ (Mon., 8 ET, TBS/HBO Max) — MLB.com
- Christian Yelich and the Brewers looking to get past Shohei Ohtani and the Dodgers in NLCS sequel — AP via NBC Sports
- Dodgers-Brewers NLCS Game 1 FAQ (8 p.m. ET, FOX/FOX One) — MLB.com
- In MLB’s final 4, it’s the sport’s biggest spender and 3 budget-savvy rivals — The Athletic (subscription)
Transactions & Rumors
- Poll: Who Will Win The NLCS? — MLB Trade Rumors
- Trade Deadline what-if looms large with Skubal facing Brewers in NLCS — MLB.com
- Did The Orioles Extend The Right Pitchers? — MLB Trade Rumors
Analysis · Listen (6)
Analysis
- Gavin Williams, José Ramírez Power Guardians to ALCS — FanGraphs
- Los Angeles Dodgers vs. Milwaukee Brewers: NLCS Preview — Just Baseball
- That Other Giants/Dodgers Playoff Series — Pitcher List
- NLCS Series Preview: Dodgers vs. Brewers — Baseball Prospectus (subscription)
Listen
- Guardians move on to the ALCS: World Series Champion Mike Stanton Reacts | Back to the Bullpen — Locked On MLB · 30 min
- Starkville | Tim Kurkjian and Eduardo Pérez on Baseball’s Craziest October Moments, Controversies and Stories — Rates & Barrels · 73 min
Terms in This Post
Drama Index · Leverage Index (LI) · Win Probability Added (WPA) · Hard-Hit Rate (HardHit%) · Barrel · every term in the Glossary
Sources & Notes
Built automatically from MLB Stats API, Baseball Savant, MyKBO Stats and CPBL Stats data; numbers through Oct. 10, 2026, with FIP, xFIP, WAR and wRC+ up to a day behind. Highlight videos link to MLB.com. The information used here was obtained free of charge from and is copyrighted by Retrosheet. Interested parties may contact Retrosheet at “www.retrosheet.org”. How this site works