
Sat, Oct. 17 · 1 game · Stat Lab #24: ERA- and FIP-: 100 is average, lower is better · 7-min read
Press time 10:49 CEST · Final 1/1 · Statcast: posted
- Last night: 1 final
- Game of the Night: Rays 7, Guardians 3 · Drama 2.66 ★★★
- Championship Series: CLE-TB: Tied 2-2 · LAD-MIL: Brewers win 4-0
- Tonight: 1 game · first pitch 23:08 CEST
- Stat Lab #24: ERA- and FIP-: 100 is average, lower is better
- Jump to: Glance · Tonight · Scoreboard · Bracket · Game of the Night · Performers · Statcast · Stat Lab · World · Web · Terms · Sources
Last Night at a Glance
- AL Championship Series Game 4: Rays 7, Guardians 3 · Tied 2-2
Tonight (CEST)
Sun, Oct. 18 · 1 game · none before 23:00 CEST · starters as of 10:49 CEST
| Matchup | Start CEST (ET) | Series | Away SP | Home SP | Stakes |
|---|---|---|---|---|---|
| TB 98-64 @ CLE 85-77 | 23:08 (5:08 p.m.) | ALCS G5 of 7 | Drew Rasmussen 2.67 · 2.81 · 21.2% · 172.0 | Parker Messick 2.56 · 3.07 · 19.3% · 186.1 | — |
Scoreboard
| Matchup | Final | Drama | Decisions | Links |
|---|---|---|---|---|
| TB @ CLE | 7-3 | 2.66 ★★★ | W Martinez · L Espino | Box · Savant |
The Bracket
Wild Card Series (best of three, every game at the higher seed)
- AL: White Sox at Astros: White Sox win 2-0.
- AL: Red Sox at Yankees: Yankees win 2-0.
- NL: Phillies at Braves: Braves win 2-1.
- NL: Cubs at Padres: Padres win 2-0.
Division Series (best of five)
- AL: Yankees at Rays: Rays win 3-0.
- AL: White Sox at Guardians: Guardians win 3-2.
- NL: Padres at Brewers: Brewers win 3-1.
- NL: Braves at Dodgers: Dodgers win 3-1.
Championship Series (best of seven)
- AL: Guardians at Rays: Tied 2-2 · Game 4: Sat, Oct. 17, 02:00 CEST (8:00 p.m. ET) · history: tied 2-2, the team at home in Game 4 (Guardians) won 31 of 69.
- NL: Dodgers at Brewers: Brewers win 4-0.
Game of the Night: Rays 7, Guardians 3
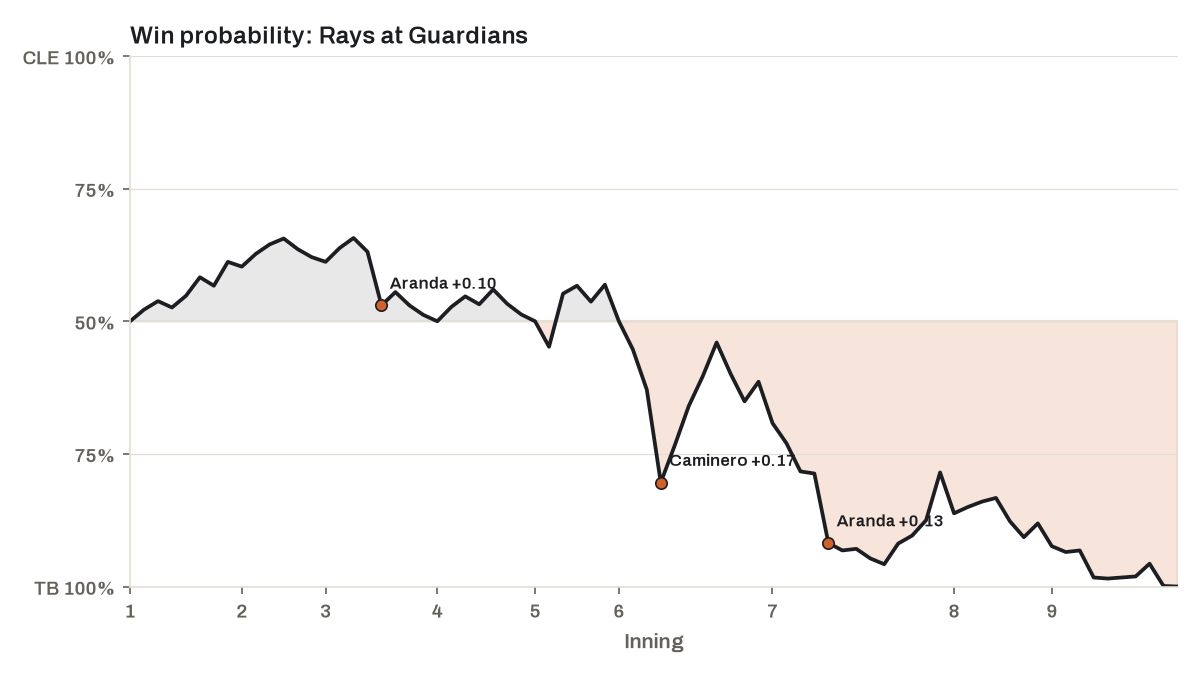
- Drama Index 2.66 ★★★ · 1 lead change · peak leverage 3.11 (bottom 6th)
- In history: 801st most dramatic of 1,878 postseason games since 1903 (Retrosheet)
- Top WPA: Jonathan Aranda +0.27 (batter) · Nick Martinez +0.19 (pitcher) · Tim Herrin +0.16 (pitcher)
- Bottom WPA: Daniel Espino -0.29 (pitcher) · Slade Cecconi -0.15 (pitcher) · Steven Kwan -0.11 (batter)
Watch: condensed game, 21 min · recap, 3 min (MLB.com)
| Inning | Matchup | Result | Win probability | WPA | LI |
|---|---|---|---|---|---|
| Top 6th | Junior Caminero vs. Daniel Espino | Double | TB 63% → 80% | +0.17 | 2.54 |
| Top 7th | Jonathan Aranda vs. Slade Cecconi | Single | TB 79% → 92% | +0.13 | 1.83 |
| Top 3rd | Jonathan Aranda vs. Foster Griffin | Single | TB 37% → 47% | +0.10 | 1.41 |
Top Performers
| Starter | Game | IP | H | R (ER) | BB | K | Pitches | GSc |
|---|---|---|---|---|---|---|---|---|
| Nick Martinez | TB @ CLE | 5.1 | 2 | 1 | 2 | 3 | 79 | 64 |
| Shawn Armstrong | CLE vs. TB | 1.0 | 0 | 0 | 0 | 1 | 13 | 47 |
| Batter | Team | Line | WPA |
|---|---|---|---|
| Jonathan Aranda | TB | 3-for-4, 2 RBI, BB | +0.27 |
| Junior Caminero | TB | 1-for-5, 2B, 1 RBI | +0.12 |
| Travis Bazzana | CLE | 2-for-3, HR, 1 RBI, BB | +0.08 |
| Chandler Simpson | TB | 0-for-3, 1 RBI, BB | +0.07 |
| Richie Palacios | TB | 3-for-4, SB | +0.07 |
Statcast Corner
| Category | Player | Detail | Where |
|---|---|---|---|
| Hardest-hit ball | Junior Caminero (TB) | 110.7 mph (178 km/h) fly ball out off Foster Griffin | TB @ CLE, top 4 |
| Fastest pitch | Daniel Espino (CLE) | 99.5 mph (160 km/h) four-seamer to Jonathan Aranda | TB @ CLE, top 6 |
| Unluckiest out | Chase DeLauter (CLE) | fly ball out, xBA .720, 102.8 mph (165 km/h), caught by CF Cedric Mullins | TB @ CLE, bot 6 |
| Longest home run | Travis Bazzana (CLE) | 374 ft (114 m), 107.8 mph (173 km/h) | TB @ CLE, bot 7 |
Stat Lab · Lesson 24: ERA- and FIP-: 100 is average, lower is better
Bryan Baker faced three batters in a 7-3 Rays win over the Guardians last night, and nobody scored while he was on the mound. His ERA is 1.44, and next to it sits a stranger number: an ERA- of 35. That is not an ERA. It is his ERA as a percentage of the league average, once his ballparks and his league are accounted for. He has been 65 percent better than average.
The idea. The same pitching allows more runs in a season when the whole league hits well, and more in a park where the ball carries. ERA- removes both. It compares a pitcher’s ERA with his league’s average, adjusts for his ballparks with a park factor, and multiplies by 100. So 100 is average, and 80 means an ERA 20 percent below average. FIP- does the same for FIP. The hitting cousins, OPS+ and wRC+, use the same scale, but for hitters higher is better.
The math. The league ERA this season, rebuilt from every pitcher in the majors, is 4.18. Unadjusted, his ratio is 100 × 1.44 ÷ 4.18 ≈ 34. His published ERA- is 35. The +1 is what the park and league adjustments add: pitcher-friendly parks or a lower-scoring league made his job a little easier, so ERA- is one point less flattering. (Published ERA- can lag a day; until it catches up, last night’s outing is part of that difference.) Then 100 − 35 = 65: 65 percent better than average. His FIP of 3.07 becomes a FIP- of 74 the same way.
The scale. By definition, 100 is average. Yet 61% of the 327 pitchers with 50-plus innings are under 100, because the pitchers who pile up innings tend to be the good ones. Bryan Baker’s 35 is the second-lowest. Over a full season, 80 is very good. His FIP- of 74 is much higher: his strikeouts, walks and homers say good, not this good, so luck or defense helped his ERA-.
What it doesn’t tell you:
- Don’t confuse it with ERA+, which flips the fraction (league ERA over his ERA), so higher is better. An ERA- of 35 is roughly an ERA+ of 286.
- His 62 1/3 innings are a small sample: three more earned runs, with no extra innings, would lift his ERA from 1.44 to 1.87.
- Park factors are estimates, and ERA- keeps ERA’s other blind spots: the fielders, luck on balls in play, the scorer’s earned-run calls.
Try it. Take your team’s next starter: 100 × his ERA ÷ 4.18 is his raw ratio. Compare it with his ERA- (FanGraphs lists it beside FIP-). If the ERA- is lower, his parks or league have worked against him; if higher, they have helped.
Go deeper: MLB Glossary: ERA+ (the higher-is-better cousin) · MLB Glossary: Park factor · FanGraphs Library: FIP
Check yourself
- Q1. A pitcher has an ERA- of 120. Is that good?
- Q2. If the league ERA were exactly 4.00 and every park were neutral, what ERA would match Bryan Baker’s ERA- of 35?
- Q3. How can a 3.50 ERA earn a better ERA- than a 3.20 ERA?
Show answers
- A1. No. His ERA is 20 percent higher than average after adjusting for parks and league. For ERA-, lower is better.
- A2. 35 percent of 4.00, which is 1.40.
- A3. If the 3.50 came in hitter-friendly parks or a higher-scoring league, the adjustments credit it. ERA- measures a pitcher against his setting, not against the raw number.
Around the World
- KBO (Korea): Twins 1, Tigers 5 (Semi-playoff)
- CPBL (Taiwan): Brothers 0, Dragons 3 (Taiwan Series Game 1, shutout)
- Dominican Winter League: Gigantes 7, Tigres 1 · Toros 5, Aguilas 3 · Leones 3, Estrellas 8
- Venezuelan Winter League: Navegantes 4, Cardenales 7 · Leones 8, Caribes 9 · Tigres 7, Tiburones 6 (10) · Bravos 7, Aguilas 6
- Mexican Pacific League: Guasave 9, Mazatlan 6 · Obregon 0, Mexicali 1 (shutout) · Culiacan 3, Los Mochis 4 · Jalisco 6, Nayarit 0 (shutout) · Hermosillo 6, Navojoa 8
- Arizona Fall League: Rafters 5, Solar Sox 0 (shutout) · Scorpions 2, Javelinas 1 (8) · Saguaros 10, Desert Dogs 0 (shutout)
Around the Web
Last Night’s Games
- Rays 7, Guardians 3 — Rays slip past Guards in Game 4 to knot up ALCS (MLB.com)
News
- Rays-Guardians ALCS Game 5 (5 ET on TBS/HBO Max) — MLB.com
- Shohei Ohtani’s health and a possible lockout loom over an uncertain offseason for the Dodgers — AP via NBC Sports
- The Brewers got it Made: In World Series for first time in 44 years, Milwaukee also has MLB’s No. 1 prospect — CBS Sports
- Shohei Ohtani Dodgers Tokyo Series jersey sells for record $2 million — The Athletic (subscription)
Transactions & Rumors
- Poll: Does Paul Skenes Just Need To Fix His Changeup? — MLB Trade Rumors
- Preller Discusses Ethan Salas, Padres’ Catchers — MLB Trade Rumors
Analysis · Listen (5)
Analysis
- Who Needs a Dome? Rays Even ALCS in Frigid Game 4 — FanGraphs
- The Tigers’ Rule 5 Protections and 40-Man Roster Crunch — Just Baseball
- OTW 270 – 2027 Opportunity Knocking: NL Central — Pitcher List
- Members-Only Game Thread: ALCS – Oct 17, 2026 — FanGraphs
Listen
Terms in This Post
Drama Index · Leverage Index (LI) · Win Probability Added (WPA) · Hard-Hit Rate (HardHit%) · Barrel · every term in the Glossary
Sources & Notes
Built automatically from MLB Stats API, Baseball Savant, MyKBO Stats and CPBL Stats data; numbers through Oct. 17, 2026, with FIP, xFIP, WAR and wRC+ up to a day behind. Highlight videos link to MLB.com. The information used here was obtained free of charge from and is copyrighted by Retrosheet. Interested parties may contact Retrosheet at “www.retrosheet.org”. How this site works