
Thu, Sept. 24 · 12 games · Stat Lab #1: ERA vs. FIP: the luck detector · 17-min read
Press time 13:53 CEST · Final 12/12 · Statcast: posted · Headlines: 3/32 feeds failed
- Last night: 12 final
- Game of the Night: Reds 7, Braves 6 · Drama 3.88 ★★★★
- Clinched: Guardians (playoff berth) · White Sox (playoff berth) · Brewers (best record in the league) · Cubs (wild card) · Padres (wild card)
- Eliminated: Orioles · Mariners
- Race: AL West tied (Astros, Rangers), 3 left · NL last wild card: Phillies +2 on D-backs, magic 2
- Tonight: 17 games · first pitch 19:05 CEST
- Stat Lab #1: ERA vs. FIP: the luck detector
- Jump to: Glance · Scoreboard · Tonight · Race · Game of the Night · Watch · Performers · Statcast · Stat Lab · Seen · Wire · World · Web · Terms · Sources
Last Night at a Glance
- Clinched: Guardians (playoff berth) · White Sox (playoff berth) · Brewers (best record in the league) · Cubs (wild card) · Padres (wild card)
- Eliminated: Orioles · Mariners
- Multi-homer games: Lucas Spence (HOU) 3 HR · Zack Gelof (ATH) 2 HR
- 10+ strikeouts: Tyler Glasnow (LAD) 11 K
- Comebacks: Yankees from 4 down: Rays 4, Yankees 6 · Reds from 3 down: Reds 7, Braves 6
- Shutouts: Guardians 1, Red Sox 0
Scoreboard
| Matchup | Final | Drama | Decisions | Links |
|---|---|---|---|---|
| CIN @ ATL | 7-6 | 3.88 ★★★★ | W Phillips · L Smith-Shawver · S Pagán | Box · Savant |
| HOU @ ATH | 7-5 | 3.57 ★★★★ | W Ullola · L Blewett · S Abreu | Box · Savant |
| TB @ NYY | 4-6 | 3.31 ★★★★ | W Hanner · L Matz | Box · Savant |
| LAA @ SEA | 6-4 | 3.30 ★★★★ | W Rodriguez · L Woo · S Watson | Box · Savant |
| MIA @ CHC | 1-2 | 3.03 ★★★★ | W Boyd · L Ralston · S Zeferjahn | Box · Savant |
| MIL @ PHI | 5-1 | 2.78 ★★★ | W Romero · L Alvarado · S Senzatela | Box · Savant |
| STL @ PIT | 1-2 | 2.76 ★★★ | W Weaver · L Stanek · S Montgomery | Box · Savant |
| CLE @ BOS | 1-0 | 2.32 ★★★ | W Cantillo · L Suarez · S Smith | Box · Savant |
| SD @ LAD | 4-2 | 2.19 ★★ | W Matsui · L Glasnow · S Miller | Box · Savant |
| NYM @ TEX | 1-3 | 2.00 ★★ | W Rocker · L Thornton · S Montgomery | Box · Savant |
| AZ @ COL | 12-8 | 0.86 ★ | W Rodriguez · L Gordon | Box · Savant |
| CWS @ KC | 9-1 | 0.82 ★ | W Sandlin · L Dobnak | Box · Savant |
Tonight (CEST)
Fri, Sept. 25 · 17 games · 2 start before 23:00 CEST · starters as of 13:52 CEST
| Matchup | Start CEST (ET) | Series | Away SP | Home SP | Stakes |
|---|---|---|---|---|---|
| CHC 88-71 @ BOS 85-74 | 19:05 ● (1:05 p.m.) | G1/3 · DH 1 of 2 moved from Sept. 27 | Clay Holmes 3.25 · 3.62 · 9.0% · 97.0 | Alec Gamboa (2/20 GS) 1.16 · 3.16 · 9.9% · 31.0 | — |
| BAL 78-81 @ NYY 92-67 | 22:05 ● (4:05 p.m.) | DH 1 of 2 | Brandon Young 3.62 · 4.53 · 10.6% · 151.2 | TBD | — |
| BAL 78-81 @ NYY 92-67 | after G1 | DH 2 of 2 makeup of Sept. 26 | Trevor Rogers 4.07 · 3.50 · 16.7% · 165.2 | Brendan Beck (1/3 GS) 8.22 · 10.53 · 0.0% · 7.2 | — |
| CHC 88-71 @ BOS 85-74 | Sat 00:05 (6:05 p.m.) | G2/3 · DH 2 of 2 | David Peterson 4.96 · 4.03 · 10.6% · 143.1 | Brayan Bello (10/25 GS) 4.49 · 4.00 · 11.3% · 112.1 | — |
| TB 96-63 @ PHI 87-72 | Sat 00:40 (6:40 p.m.) | G1/3 | Freddy Peralta 4.56 · 4.31 · 13.0% · 163.2 | Cristopher Sánchez 2.93 · 2.81 · 21.3% · 200.0 | NL WC: PHI magic 2 |
| PIT 81-78 @ DET 74-85 | Sat 00:40 (6:40 p.m.) | G1/3 | Bubba Chandler 4.34 · 4.21 · 9.4% · 151.1 | Jackson Jobe 3.98 · 4.55 · 16.9% · 40.2 | — |
| NYM 73-86 @ WSH 75-84 | Sat 00:45 (6:45 p.m.) | G1/3 | TBD | Andrew Alvarez 3.17 · 3.13 · 13.1% · 108.0 | — |
| CIN 74-85 @ TOR 77-82 | Sat 01:07 (7:07 p.m.) | G1/3 | Nick Lodolo 5.04 · 5.77 · 7.8% · 103.2 | TBD | — |
| ATL 93-66 @ MIA 78-81 | Sat 01:10 (7:10 p.m.) | G1/3 | TBD | Eury Pérez 4.14 · 4.21 · 15.1% · 150.0 | — |
| STL 77-82 @ MIL 100-59 | Sat 01:40 (7:40 p.m.) | G1/3 | Michael McGreevy 3.84 · 4.24 · 9.9% · 164.0 | Robert Gasser 4.01 · 4.32 · 13.5% · 103.1 | — |
| CLE 83-76 @ KC 68-91 | Sat 01:40 (7:40 p.m.) | G1/3 | Gavin Williams 3.63 · 3.38 · 25.7% · 181.0 | Noah Cameron 3.92 · 3.76 · 14.1% · 172.1 | AL Central: CLE magic 3 |
| COL 57-102 @ CWS 82-77 | Sat 01:40 (7:40 p.m.) | G1/3 | Tomoyuki Sugano 5.36 · 5.38 · 8.7% · 147.2 | Sean Burke 3.40 · 3.62 · 16.8% · 167.0 | AL Central: CWS elim 3 |
| TEX 79-80 @ MIN 75-84 | Sat 02:10 (8:10 p.m.) | G1/3 | Jacob deGrom 3.86 · 3.11 · 23.7% · 158.2 | Joe Ryan 3.83 · 3.75 · 20.6% · 138.2 | AL West: tied (HOU, TEX) |
| AZ 85-74 @ SD 89-70 | Sat 03:40 (9:40 p.m.) | G1/3 | Brandon Pfaadt 3.72 · 4.00 · 10.7% · 128.1 | TBD | NL WC: AZ elim 2 |
| HOU 79-80 @ ATH 63-96 | Sat 03:40 (9:40 p.m.) | G2/4 | Hunter Brown 3.26 · 3.76 · 16.2% · 102.0 | Jacob Lopez 5.68 · 5.23 · 9.8% · 117.1 | AL West: tied (HOU, TEX) |
| LAA 61-98 @ SEA 74-85 | Sat 04:10 (10:10 p.m.) | G2/4 | Reid Detmers 3.47 · 3.05 · 22.0% · 179.0 | Bryce Miller 3.99 · 4.43 · 16.6% · 112.2 | — |
| LAD 97-62 @ SF 65-94 | Sat 04:15 (10:15 p.m.) | G1/3 | Tarik Skubal 2.85 · 2.61 · 25.0% · 151.2 | Yunior Marte 4.66 · 5.37 · 2.4% · 19.1 | — |
The Race
| Division | Leader | Chaser | Lead | Games left | Magic # |
|---|---|---|---|---|---|
| AL Central | Guardians | White Sox | 1 | 3 | 3 |
| AL West | Astros | Rangers | tied | 3 | 4 |
| Team | W-L | vs. 3rd wild card |
|---|---|---|
| Yankees | 92-67 | +10 |
| Red Sox | 85-74 | +3 |
| White Sox | 82-77 | cut line |
| Rangers | 79-80 | -3 |
| Orioles | 78-81 | -4 |
| Blue Jays | 77-82 | -5 |
| Team | W-L | vs. 3rd wild card |
|---|---|---|
| Padres | 89-70 | +2 |
| Cubs | 88-71 | +1 |
| Phillies | 87-72 | cut line |
| D-backs | 85-74 | -2 |
| [AL Central] CLE 83-76 · CWS 82-77 · 1.0 · magic CLE 3 |
|---|
| Tonight: CLE @ KC 01:40 CEST · COL @ CWS 01:40 CEST |
| Decided tonight: no (magic 3; at most 2 tonight) |
| Tiebreaker: CWS · head-to-head 7-6, final |
| Remaining: CLE 3 at KC (68-91) · CWS 3 vs COL (57-102) |
| [AL West] HOU 79-80 · TEX 79-80 · tied · magic HOU 3 (tiebreaker counted), TEX 4 |
|---|
| Tonight: TEX @ MIN 02:10 CEST · HOU @ ATH 03:40 CEST |
| Decided tonight: no (magic 3; at most 2 tonight) |
| Tiebreaker: HOU · head-to-head 9-4, final |
| Remaining: HOU 3 at ATH (63-96) · TEX 3 at MIN (75-84) |
| [NL 3rd wild card] PHI 87-72 · AZ 85-74 · 2.0 · magic PHI 2 |
|---|
| Tonight: TB @ PHI 00:40 CEST · AZ @ SD 03:40 CEST |
| Decided tonight: PHI wins + AZ losses >= 2 (PHI 1 game, AZ 1) |
| Tiebreaker: AZ · head-to-head 3-3 → intradivision AZ 31-18 (3 left) v PHI 28-24 (0 left), locked |
| Remaining: PHI 3 vs TB (96-63) · AZ 3 at SD (89-70) |
| If the season ended today |
|---|
| AL: #1 TB bye · #2 CLE bye · #3 HOU v #6 CWS · #4 NYY v #5 BOS |
| NL: #1 MIL bye · #2 LAD bye · #3 ATL v #6 PHI · #4 SD v #5 CHC |
All 30 teams
| Team | W-L | GB | L10 | Strk | RD | Pythag W-L | Clinch | Δ |
|---|---|---|---|---|---|---|---|---|
| AL East | ||||||||
| TB | 96-63 | — | 6-4 | L2 | +77 | 88-71 | z | |
| NYY | 92-67 | 4.0 | 6-4 | W2 | +143 | 95-64 | w | |
| BOS | 85-74 | 11.0 | 4-6 | L1 | +79 | 88-71 | w | |
| BAL | 78-81 | 18.0 | 6-4 | W3 | -26 | 77-82 | e | |
| TOR | 77-82 | 19.0 | 3-7 | L3 | -47 | 74-85 | e | |
| AL Central | ||||||||
| CLE | 83-76 | — | 8-2 | W1 | +3 | 80-79 | x | |
| CWS | 82-77 | 1.0 | 6-4 | W1 | +52 | 85-74 | x | |
| MIN | 75-84 | 8.0 | 5-5 | W2 | -64 | 73-86 | e | |
| DET | 74-85 | 9.0 | 4-6 | L2 | +71 | 87-72 | e | WC ▲1 |
| KC | 68-91 | 15.0 | 2-8 | L1 | -112 | 68-91 | e | |
| AL West | ||||||||
| HOU | 79-80 | — | 4-6 | W1 | -51 | 74-85 | ||
| TEX | 79-80 | — | 6-4 | W1 | -40 | 75-84 | ||
| SEA | 74-85 | 5.0 | 4-6 | L1 | -64 | 73-86 | e | |
| ATH | 63-96 | 16.0 | 3-7 | L1 | -219 | 60-99 | e | |
| LAA | 61-98 | 18.0 | 5-5 | W1 | -91 | 70-89 | e | |
| NL East | ||||||||
| ATL | 93-66 | — | 5-5 | L1 | +116 | 92-67 | y | |
| PHI | 87-72 | 6.0 | 5-5 | L2 | +24 | 82-77 | WC ▼1 | |
| MIA | 78-81 | 15.0 | 5-5 | L1 | +3 | 80-79 | e | |
| WSH | 75-84 | 18.0 | 7-3 | W2 | +9 | 80-79 | e | |
| NYM | 73-86 | 20.0 | 4-6 | L1 | -35 | 76-83 | e | WC ▼1 |
| NL Central | ||||||||
| MIL | 100-59 | — | 7-3 | W2 | +207 | 100-59 | z | |
| CHC | 88-71 | 12.0 | 5-5 | W1 | +146 | 93-66 | w | |
| PIT | 81-78 | 19.0 | 7-3 | W1 | +28 | 82-77 | e | |
| STL | 77-82 | 23.0 | 4-6 | L1 | -22 | 77-82 | e | |
| CIN | 74-85 | 26.0 | 4-6 | W1 | -159 | 64-95 | e | |
| NL West | ||||||||
| LAD | 97-62 | — | 7-3 | L2 | +194 | 100-59 | y | |
| SD | 89-70 | 8.0 | 8-2 | W2 | +40 | 84-75 | w | |
| AZ | 85-74 | 12.0 | 6-4 | W5 | +10 | 81-78 | ||
| SF | 65-94 | 32.0 | 3-7 | L2 | -84 | 71-88 | e | |
| COL | 57-102 | 40.0 | 2-8 | L4 | -188 | 63-96 | e |
Game of the Night: Reds 7, Braves 6
- Drama Index 3.88 ★★★★ · 4 lead changes · Reds came back from 3 down · peak leverage 6.23 (bottom 9th)
- Top WPA: Emilio Pagán +0.34 (pitcher) · Héctor Rodríguez +0.27 (batter) · Eugenio Suárez +0.20 (batter)
- Bottom WPA: Brady Singer -0.36 (pitcher) · Ozzie Albies -0.30 (batter) · Tyler Mahle -0.23 (pitcher)
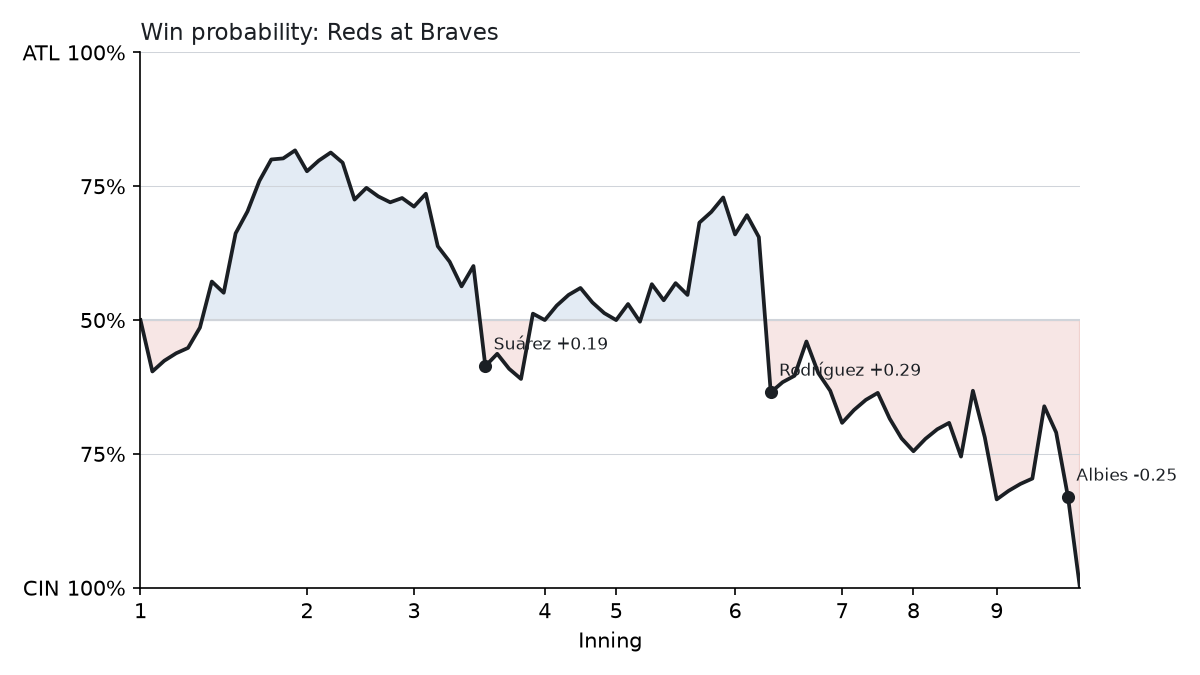
| Inning | Matchup | Result | Win probability | WPA | LI |
|---|---|---|---|---|---|
| Top 6th | Héctor Rodríguez vs. AJ Smith-Shawver | Home Run | CIN 34% → 64% | +0.29 | 2.03 |
| Bot 9th | Ozzie Albies vs. Emilio Pagán | Strikeout | ATL 42% → 17% | -0.25 | 5.22 |
| Top 3rd | Eugenio Suárez vs. Tyler Mahle | Single | CIN 40% → 59% | +0.19 | 2.44 |
Watch
- Astros 7, Athletics 5 · full-game highlights (MLB)
- Rays 4, Yankees 6 · full-game highlights (MLB)
- Angels 6, Mariners 4 · full-game highlights (MLB)
- Brewers 5, Phillies 1 · full-game highlights (MLB)
- Guardians 1, Red Sox 0 · full-game highlights (MLB)
Top Performers
| Starter | Game | IP | H | R (ER) | BB | K | Pitches | GSc |
|---|---|---|---|---|---|---|---|---|
| Ian Seymour | TB @ NYY | 5.0 | 1 | 0 | 0 | 3 | 58 | 71 |
| Tyler Glasnow | LAD vs. SD | 6.1 | 3 | 3 | 2 | 11 | 91 | 70 |
| Matthew Boyd | CHC vs. MIA | 7.0 | 5 | 1 | 2 | 3 | 90 | 68 |
| Paul Skenes | PIT vs. STL | 6.1 | 3 | 1 | 2 | 8 | 96 | 67 |
| Andrew Painter | PHI vs. MIL | 6.0 | 5 | 1 | 3 | 8 | 93 | 65 |
| Batter | Team | Line | WPA |
|---|---|---|---|
| Lucas Spence | HOU | 3-for-4, 3 HR, 5 RBI | +0.51 |
| Christian Moore | LAA | 2-for-4, 2B, 3 RBI | +0.47 |
| George Lombard Jr. | NYY | 2-for-4, HR, 2B, 3 RBI | +0.40 |
| Jeff McNeil | ATH | 2-for-4, HR, 2B, 3 RBI | +0.28 |
| Héctor Rodríguez | CIN | 2-for-4, HR, 2B, 2 RBI | +0.27 |
Statcast Corner
- 600 tracked balls in play, 40% hard-hit (95+ mph), 53 barrels
- 37 pitches at 100+ mph from 9 pitchers
| Category | Player | Detail | Where |
|---|---|---|---|
| Unluckiest out | Bryan De La Cruz (PHI) | line drive out, xBA .986, 75.2 mph (121 km/h), caught by 2B Brice Turang | MIL @ PHI, bot 9 |
| Fastest pitch | Mason Miller (SD) | 102.6 mph (165 km/h) four-seamer to Shohei Ohtani | SD @ LAD, bot 9 |
| Longest home run | Julio Rodríguez (SEA) | 451 ft (137 m), 109.2 mph (176 km/h) | LAA @ SEA, bot 2 |
| Hardest-hit ball | Kyle Schwarber (PHI) | 111.8 mph (180 km/h) double off Shane Drohan | MIL @ PHI, bot 3 |
Stat Lab · Lesson 1: ERA vs. FIP: the luck detector
Yuki Matsui pitched in a 4-2 Padres win over the Dodgers last night and faced four batters (1 hit, 0 walks, 1 strikeout). His season line holds two numbers that flatly disagree: an ERA of 1.84 and a FIP of 4.26. Same pitcher, same 63 2/3 innings, a 2.42-run argument. ERA calls his season brilliant; FIP calls it roughly league average. Which one should you believe?
The idea. ERA charges a pitcher for every earned run, which bundles his own work with things he barely controls: the fielders behind him and where balls in play happen to land. FIP keeps only the four outcomes that involve no fielder at all: strikeouts, walks, hit batters and home runs. It rests on DIPS theory, the finding that pitchers have far less say over whether a ball in play becomes a hit than over those four events. That is why FIP predicts a pitcher’s future ERA better than his current ERA does.
The math. FIP = (13×HR + 3×(BB + HBP) − 2×K) ÷ IP + constant. The weights roughly track what each event is worth in runs, and the constant (3.095 this season, from league totals) makes league FIP equal league ERA, 4.17. For Yuki Matsui: (13×7 + 3×(36 + 2) − 2×67) ÷ 63.67 + 3.095 = (91 + 114 − 134) ÷ 63.67 + 3.095 = 1.115 + 3.095 = 4.210; the published 4.26 doesn’t include last night yet. (The box score’s 63.2 means 63 2/3 innings: the .2 counts outs, so the divisor is 63.67.)
The scale. Read FIP like ERA: 4.17 is average this year, about 3.00 excellent and 5.00 trouble. Among the 459 pitchers with 30-plus innings, 48% have an ERA within half a run of their FIP; Yuki Matsui’s 2.42 is the second-largest. When ERA sits this far below FIP, it tends to climb toward it. One clue: his BABIP against is .204, where the league usually lands near .290. Far fewer balls in play than usual have fallen in.
What it doesn’t tell you:
- 63 2/3 innings is a small sample: a single five-run inning would lift his ERA from 1.84 to 2.51.
- Weak contact, a great defense or a big ballpark can keep a pitcher ahead of his FIP for years.
- Homers per fly ball are streaky, and FIP counts every homer at full weight. xFIP uses a league-average rate instead; his is 4.69.
- ERA also ignores inherited runners: 9 of his 34 scored, and none of those runs count against him.
Try it. Take any pitcher from last night and compute his FIP from his season K, BB, HBP, HR and innings, with this year’s constant of 3.10. Is his gap to ERA bigger or smaller than Yuki Matsui’s 2.42?
Go deeper: MLB Glossary: FIP · FanGraphs Library: FIP · FanGraphs Library: DIPS
Check yourself
- Q1. If Yuki Matsui had struck out one more batter this season, how much lower would his FIP be?
- Q2. His ERA is 1.84 and his FIP is 4.26. Over his next 50 innings, which way would you bet his ERA moves?
- Q3. Why does FIP add a constant at all?
Show answers
- A1. 2 ÷ 63.67 = 0.031 runs, since each strikeout is worth −2 in the numerator. A walk would cost 3 ÷ 63.67 = 0.047, a home run 13 ÷ 63.67 = 0.204.
- A2. Up, toward his FIP. The gap mostly comes from balls in play and sequencing, which don’t carry over well; his .204 BABIP is the loudest signal.
- A3. Only to put it on the ERA scale. Across the league the raw part averages 1.07; adding 3.10 lifts it to the league ERA of 4.17, so a FIP of 3.50 reads like an ERA of 3.50.
Seen Last Night: Strike ’em out, throw ’em out
Strike ’em out, throw ’em out. Two outs without a ball in play: the Mariners turned a strikeout double play against the Angels in the top of the 3rd of the Angels-Mariners game, Wade Meckler going down on strikes, and it cost the Angels 5.5 points of win probability.
These plays are often a hit-and-run or a steal attempt gone wrong. The batter swings through strike three, and the runner, already committed to the next base, is left hanging. It is a double penalty for the offense: an out at the plate and a runner erased.
Transaction Wire
- Giants: claimed RHP Camilo Doval off waivers from Pirates · MLB Trade Rumors
- Astros: designated RHP Jason Alexander for assignment
- Braves: LHP Martín Pérez to the 15-day IL (back, retroactive to Sept. 21, 1.5 WAR this season) · MLB Trade Rumors · The Athletic (subscription)
- Orioles: RHP Kyle Bradish moved to the 60-day IL (abdominal, 1.5 WAR this season)
- Astros: CF Daulton Varsho to the 10-day IL (left wrist, retroactive to Sept. 23) · MLB Trade Rumors
- Giants: RHP Blade Tidwell moved to the 60-day IL
- Royals: RHP Steven Cruz to the paternity list
- Astros: selected CF Jorge Barrosa from Sugar Land Space Cowboys
More moves (19)
- Angels: RHP Ben Joyce to the 15-day IL
- Angels: recalled RHP Trevor Martin from Salt Lake Bees
- Braves: RHP Hurston Waldrep to the 60-day IL
- Braves: selected RHP Elieser Hernández from Gwinnett Stripers · MLB Trade Rumors
- Braves: recalled RHP Hurston Waldrep from Gwinnett Stripers
- Braves: status change for RHP Elieser Hernández
- Mariners: SS Brock Rodden to the 10-day IL
- Mariners: recalled 3B Leo Rivas from Tacoma Rainiers
- Orioles: selected RHP Albert Suárez from Norfolk Tides · MLB Trade Rumors
- Orioles: optioned RHP Trey Gibson to FCL Orioles
- Pirates: recalled LHP Evan Sisk from Indianapolis Indians
- Pirates: optioned RHP Khristian Curtis to FCL Pirates
- Rays: selected RHP Jake Woodford from Durham Bulls · MLB Trade Rumors
- Rays: optioned RHP Mason Englert to Durham Bulls
- Royals: recalled RHP Spencer Bivens from ACL Royals
- White Sox: RHP Luis Castillo to the 15-day IL · MLB Trade Rumors
- White Sox: recalled RHP Tyler Davis from Charlotte Knights
- Yankees: RHP Clarke Schmidt to the 15-day IL · MLB Trade Rumors
- Yankees: recalled RHP Bradley Hanner from Scranton/Wilkes-Barre RailRiders
Around the World
- NPB (Japan): Golden Eagles 6, Fighters 0 (shutout) · Giants 1, Carp 3
- KBO (Korea): Dinos 2, Wiz 3 · Lions 5, Landers 4 · Giants 6, Twins 4
- CPBL (Taiwan): Dragons 2, Lions 4 · Guardians 8, Hawks 0 (shutout) · Brothers 5, Monkeys 6
Around the Web
Last Night’s Games
- Astros 7, Athletics 5 — Lucas the legend! Spence’s 3-HR game keeps Astros in first-place tie (MLB.com)
- Rays 4, Yankees 6 — Lombard’s mind-bending contortionist moves flummox Rays catcher after WP (MLB.com)
- Marlins 1, Cubs 2 — Fernández’s indelible imprint still felt on Marlins’ franchise 10 years after his tragic death (MLB.com)
- Brewers 5, Phillies 1 — Brewers reach 100 wins for 1st time, lock up home field as No. 1 overall seed (MLB.com)
- Guardians 1, Red Sox 0 — Guardians clinch 3rd consecutive playoff berth with another late surge (MLB.com)
- Padres 4, Dodgers 2 — Dodgers earn first-round bye after securing Top 2 seed in NL (MLB.com)
- Mets 1, Rangers 3 — Rangers keep pace as AL West fight comes down to final weekend (MLB.com)
- D-backs 12, Rockies 8 — Snakes (still) alive! D-backs sweep Rockies clinging to playoff hopes with 3 to play (MLB.com)
- White Sox 9, Royals 1 — White Sox clinch postseason berth as inspiring turnaround continues (MLB.com)
News
- Will we see a 1st-time World Series winner? 3 teams have strong case — MLB.com
- 2026 MLB Playoffs Update: Clinch scenarios, schedule, tiebreakers, and more — NBC Sports
Transactions & Rumors
- Twins Part Ways With Assistant GM Daniel Adler — MLB Trade Rumors
- Willson Contreras Dealing With Lingering Hand Pain — MLB Trade Rumors
Watch
- Ben Rice put up a MONSTER season | MLB Central — MLB Network
- Laz Diaz has one of the worst innings ever, a breakdown — Jomboy Media
Analysis · Prospects · Listen (5)
Analysis
- Are World Baseball Classic Players Actually Underperforming in 2026? — FanGraphs
- Lineup Lockdown: Around The League, September 2026 — Baseball Prospectus (subscription)
Prospects
- Can The Dodgers Trust Josue De Paula’s Outfield Defense? — Baseball America (subscription)
- The Top 10 MLB Pitching Prospect Performances Of 2026 — Baseball America (subscription)
Listen
- 40/40 for PCA; Cubs, 3 others grab playoff spots — MLB Morning Lineup · 13 min
Terms in This Post
Drama Index
Our own measure of how much a game kept both sides guessing: the total of every swing in win probability over the game, divided by 100. A game that one team controls from the first inning scores low; a game full of lead changes and late swings scores high.
It ranks a night’s games by how tense they actually were, which is how we pick the Game of the Night.
Drama Index = sum of |win probability change| over every plate appearance ÷ 100
Leverage Index (LI)
How much the next plate appearance can swing win probability, compared with an average plate appearance. 1.0 is average; 2.0 means twice the usual stakes.
It shows where games are really decided, and it is the right way to judge when a manager should use his best reliever.
- 0.85: Below this: low leverage
- 1.0: Average
- 2.0: Above this: high leverage
- 5.0: Rare: only a few plate appearances a night reach it
Win Probability Added (WPA)
How much one play changed a team’s chance of winning. The batter is credited with the change and the pitcher is charged the same amount with the opposite sign; add up a player’s plays and you get his WPA for a game or a season.
It tells the story of a game in numbers: who delivered when it mattered most.
WPA = win probability after the play − win probability before it
Hard-Hit Rate (HardHit%)
The share of a hitter’s batted balls with an exit velocity of 95 mph or more.
At 95 mph and above, batted balls start producing far more hits and extra bases.
It ignores launch angle, so a pile of hard grounders can inflate it.
Barrel
Statcast’s label for the ideal batted ball: hit at least 98 mph at a launch angle whose historical results average at least .500 with a 1.500 slugging percentage. At 98 mph only about 26 to 30 degrees qualify; the window widens as exit velocity climbs.
Barrels turn into home runs and doubles far more than any other contact, so barrel rate is a strong sign of real power.
A barrel can still be caught or held in the park; it describes contact quality, not the result.
Sources & Notes
Assembled automatically each morning by The Daily Whiff’s software from MLB Stats API and Baseball Savant data. How this site works
Season numbers are through Sept. 24, 2026; advanced metrics from the MLB Stats API (FIP, xFIP, WAR, wRC+) can run a day behind. Data: MLB Advanced Media, used under its individual, non-commercial terms; video embeds come from MLB’s official YouTube channel.
Around the Web headlines link to their outlets and belong to their publishers; no excerpts or images are reproduced. Tables, analysis and charts © The Daily Whiff. Independent fan site, not affiliated with MLB or any club.
Glossaries: MLB glossary · FanGraphs Library