
Sunday, Nov. 1, 2026No. 38Morning editionNumbers through Sat, Oct. 31Hot Stove
16 finals around the world9 roster moves13-min readPress time 17:10 CETHeadlines: 1/20 feeds failed
In this editionDominican Winter LeagueTonightAround the WorldHot StoveOn this dayThe WeekInsideLast Nightp. 2The Wirep. 3The Weekp. 4Around the Webp. 5
The Whiff
Six at-bats from a dramatic game, one at a time. Make your call before each one plays out.
Play before you read on: the pages below can give the score away.
Dominican Winter League
Gigantes 6, Toros 5 (LIDOM)
Gigantes 6, Toros 5 (LIDOM). Orioles: CF Luis Robert Jr. elected free agency.
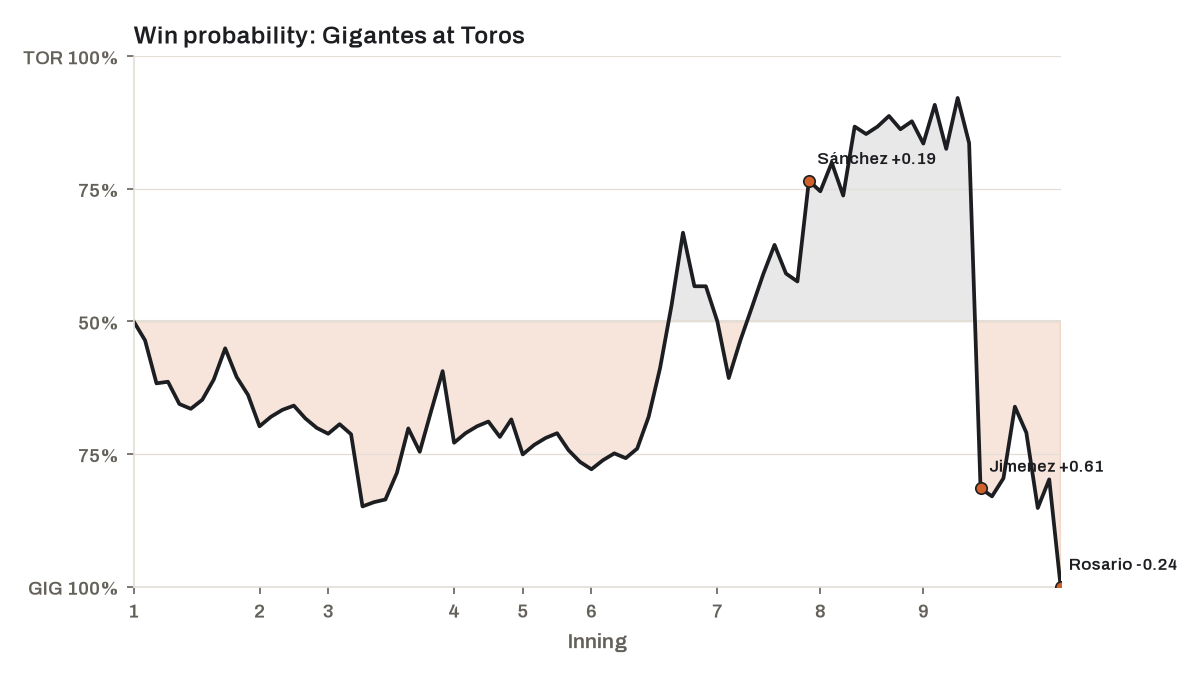
- 4.62 Drama Index, Game of the Night
- 16 finals around the world
Tonight
Jalisco at Culiacan
- League Mexican Pacific League
- First pitch Mon 01:05 CET
- Jalisco 48%
- Culiacan 52%
- Caribes at Leones · 21:00 CET · Caribes 52%
- Aguilas at Leones · 22:00 CET · Leones 59%
- Toros at Gigantes · 22:00 CET · Gigantes 51%
- Tigres at Estrellas · 22:00 CET · Estrellas 52%
Around the World
- LIDOM: Leones 4, Aguilas 1 ★★★ · Estrellas 3, Tigres 6 ★★
- LVBP: Aguilas 6, Navegantes 9 ★★★★ · Tiburones 4, Cardenales 14 ★★★ · Tigres 11, Bravos 2 ★ · Caribes 5, Leones 17 ★
- LMP: Nayarit 8, Mazatlan 5 ★★★★ · Obregon 5, Guasave 10 ★★★ · Jalisco 0, Culiacan 2 (shutout) ★★★ · Hermosillo 2, Los Mochis 4 ★★★ · Mexicali 6, Navojoa 2 ★★ · Hermosillo 7, Los Mochis 4 ★★
- AFL: Solar Sox 5, Scorpions 4 ★★★★★ · Javelinas 8, Desert Dogs 9 (walk-off) ★★★★ · Rafters 11, Saguaros 2 ★
Hot Stove
Orioles: CF Luis Robert Jr. elected free agency
- Age 29
- 2026 61 G, .707 OPS, 11 HR
- WAR 0.5
Also: Emilio Pagán elected free agency · Orioles: outrighted Codi Heuer · Orioles: outrighted Colin Selby and 5 more
On this day
World Series Game 7: Dodgers 5, Blue Jays 4 (11)
The Week
Oct. 25-31
Brewers win the World Series; Rays 4, Brewers 3 in 12 tops the week
Inside: the week at a glance · the Game of the Week · the superlatives · the leaderboards · the bracket · how our forecasts did
The Daily Whiff · Sunday, Nov. 1, 2026 Page 2
Last Night
Game of the Night: Gigantes 6, Toros 5 (LIDOM)
- Drama Index 4.62 ★★★★★ · 2 lead changes · peak leverage 7.70 (bottom 9th)
- Top WPA: Gilberto Jimenez +0.61 (batter) · Jimmy Cordero +0.37 (pitcher) · Jesús Sánchez +0.32 (batter)
- Bottom WPA: Joe Record -0.61 (pitcher) · Emiliano Teodo -0.41 (pitcher) · Mike Rosario -0.24 (batter)
Watch: Gameday (MLB.com)
| Inning | Matchup | Result | Win probability | WPA | LI |
|---|---|---|---|---|---|
| Top 9th | Gilberto Jimenez vs. Joe Record | Single | GIG 20% → 82% | +0.61 | 6.27 |
| Bot 9th | Mike Rosario vs. Jimmy Cordero | Groundout | TOR 24% → 0% | -0.24 | 7.70 |
| Bot 7th | Jesús Sánchez vs. Hansel Robles | Single | TOR 58% → 76% | +0.19 | 2.77 |
The Daily Whiff · Sunday, Nov. 1, 2026 Page 3
The Wire
Transaction Wire
- Orioles: RHP Colin Selby back from the 60-day IL
More moves (4)
- Orioles: RHP Albert Suárez elected free agency
- Orioles: SS José Barrero elected free agency
- Reds: DH Eugenio Suárez elected free agency · MLB Trade Rumors
- Reds: RHP Pierce Johnson elected free agency · MLB Trade Rumors
The Daily Whiff · Sunday, Nov. 1, 2026 Page 4
The WeekOct. 25-31, 2026
Brewers win the World Series; Rays 4, Brewers 3 in 12 tops the week
The Week at a Glance
- By the numbers: 3 games · 23 runs · 2 HR · 1 extra-inning game · 1 one-run game · 0 shutouts · 1 walk-off
- Extremes: longest: Brewers 3, Rays 4 (12), Tue Oct. 27 · most runs: Brewers 10, Rays 1, Mon Oct. 26
- Team of the week: Brewers 2-1, +11 run differential, streak W1
- Walk-offs: Brewers 3, Rays 4 (12), Tue Oct. 27: Ben Williamson single
Game of the Week: Brewers 3, Rays 4 (12)
- Tue Oct. 27 · Drama Index 4.43 ★★★★★ · 2 lead changes · stakes: postseason · 12 innings
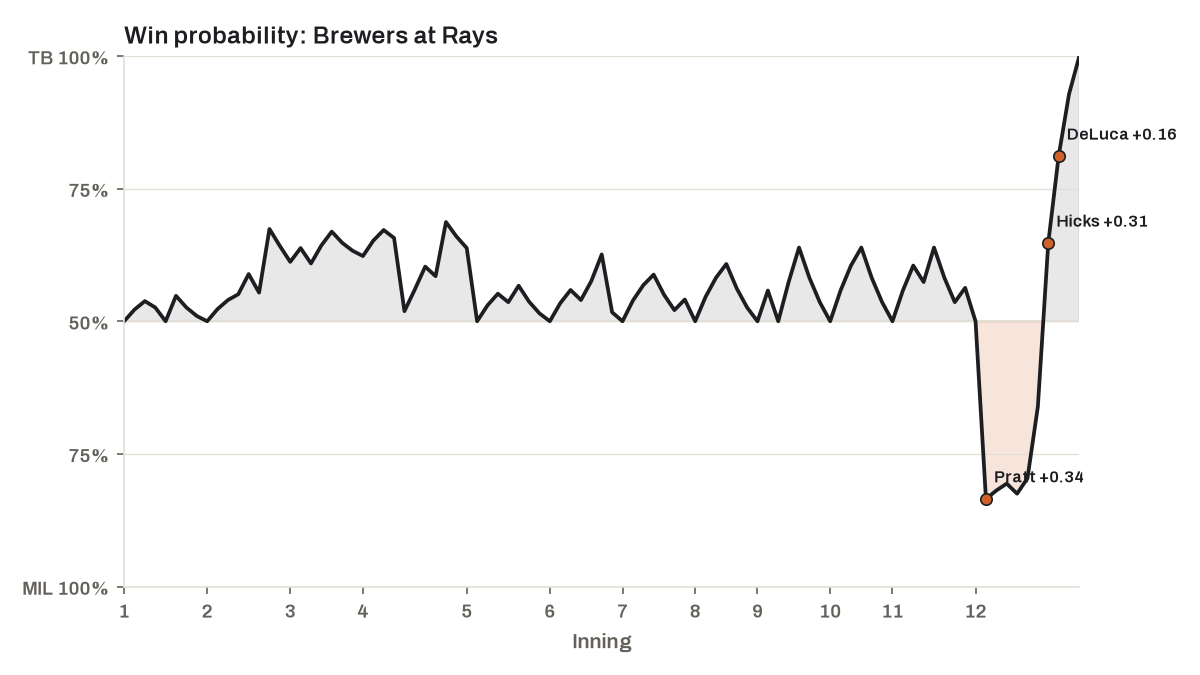
| Inning | Matchup | Result | Win probability | WPA | LI |
|---|---|---|---|---|---|
| Top 12th | Cooper Pratt vs. Ian Seymour | Home Run | MIL 50% → 84% | +0.34 | 2.29 |
| Bot 12th | Liam Hicks vs. Shane Drohan | Single | TB 34% → 65% | +0.31 | 5.48 |
| Bot 12th | Jonny DeLuca vs. Shane Drohan | Single | TB 65% → 81% | +0.16 | 4.48 |
Slugfest Superlatives
| Player | Detail | When | |
|---|---|---|---|
| Best start | Jacob Misiorowski (MIL) | +0.33 WPA over 21 batters, innings 1-6 | vs. TB, Wed Oct. 28 |
| Best relief outing | Aaron Ashby (MIL) | +0.34 WPA over 7 batters, innings 9-11, entered at LI 2.22 | vs. TB, Tue Oct. 27 |
| Biggest hit | Cooper Pratt (MIL) | home run, top 12th, 2-2 → 3-2, +0.34 WPA | vs. TB, Tue Oct. 27 |
| Toughest week at the plate | Jonathan Aranda (TB) | -0.37 WPA over 11 plate appearances | 3 games |
Leaderboards
| Batter | Team | WPA | PA | G |
|---|---|---|---|---|
| Cooper Pratt | Brewers | +0.61 | 14 | 3 |
| Liam Hicks | Rays | +0.27 | 9 | 2 |
| Chandler Simpson | Rays | +0.21 | 12 | 3 |
| David Hamilton | Brewers | +0.04 | 11 | 3 |
| Christian Yelich | Brewers | +0.04 | 13 | 3 |
| Pitcher | Team | WPA | BF | G |
|---|---|---|---|---|
| Aaron Ashby | Brewers | +0.34 | 7 | 1 |
| Jacob Misiorowski | Brewers | +0.33 | 21 | 1 |
| Bryan Baker | Rays | +0.26 | 10 | 2 |
| Tyler Wells | Rays | +0.25 | 11 | 3 |
| Robert Gasser | Brewers | +0.22 | 19 | 1 |
| Team | W-L | RS | RA | Diff |
|---|---|---|---|---|
| Brewers | 2-1 | 17 | 6 | +11 |
| Rays | 1-2 | 6 | 17 | -11 |
The Bracket
- World Series: Rays at Brewers, Brewers win 4-1 (3 games this week)
How our forecast works
A forecast here is the chance that the home team wins a game, worked out from team ratings, home field and, in MLB, the two starting pitchers.
It is not betting advice, and it does not know lineups, injuries or weather.
How it works
Every forecast is built in the steps below. Each step adds rating points to the home team’s side of the gap and the chance is worked out again, so the last step is exactly the chance that is published and recorded. Nothing is rounded between steps; a chance is rounded to a whole percent only when it is printed.
Step 1: a rating for every club
Every club has one number, its rating, and the average is 1500. When nothing else is counted, a club that is D points ahead of its opponent has a chance of 1 / (1 + 10^(−D / 400)) of winning. This is an Elo rating.
| Rating gap | 0 | 25 | 50 | 100 | 200 |
|---|---|---|---|---|---|
| Chance of the stronger club | 50% | 54% | 57% | 64% | 76% |
A club the model has not seen yet starts at 1500.
Step 2: home field
The home team gets H extra points on top of the gap before the chance is worked out. H is 24 points in MLB and 32 points in the winter leagues. Between two equal clubs that gives the home team 53.4% in MLB and 54.6% in the winter leagues.
Home-field advantage is real but small. In the games the fit learned from, the home team won 53.9% in MLB and 54.9% in the winter leagues. A game at a neutral site, such as the Caribbean Series, has no home-field step: neither club gets the points.
Step 3: the starting pitcher
In the winter leagues the starters are not counted: a winter pitcher has about ten starts to judge him by, and the announced starters are often missing from the data. In MLB the starter adds points, in five steps.
- FIP puts a pitcher’s season in one number, the runs per nine innings he would have allowed from what he controls: (13 × HR + 3 × (BB + HBP) − 2 × K) / IP + a constant. The constant makes the league’s FIP equal the league’s ERA, so FIP reads like ERA. We work it out ourselves from the pitcher’s numbers.
- This season and last season are put together. Last season’s numbers count at a weight of 0.5.
- Regression to the mean pulls the number toward the league’s: 300 innings of a league-average pitcher are added to his record. A pitcher with 20 innings keeps 6% of his own FIP, one with 200 innings keeps 40%.
- The club’s usual starter is the average of that number for the starters of its last 20 games. A club’s rating already holds its usual rotation, so only the difference from the usual starter counts.
- The difference becomes points: (usual FIP − tonight’s FIP) × the league’s average innings per start (5.19) / 9 is runs per game, and each run per game is worth 150 points, about 20 percentage points of chance.
Example: a starter at 2.80 against a usual starter at 3.90 is 1.10 runs per nine innings, × 5.19 / 9 = 0.634 runs per game, × 150 = 95.1 points for his club.
A starter who is not announced, or an opener (a pitcher who started under half of the games he pitched in), counts as the club’s usual starter: 0 points.
Step 4: one game, step by step
Tiburones at Cardenales is the first game of Nov. 1, 2026 in the record, the latest day with a forecast. Each step adds its points to the home team’s side of the gap and the chance is worked out again.
- Start: 50%. Every game begins as a coin flip.
- Ratings: Cardenales is 41.7 points ahead of Tiburones. Chance 56%.
- Home field: +32.0 points for Cardenales. The gap is now +73.7. Chance 60%.
The same walk as one line:
Built from: 50% → ratings 56% → home field 60% · starters not counted in winter ball
From the ratings and home field alone, Cardenales is expected to win 60%. If it wins, its rating moves by +3.2 points and Tiburones’s by −3.2. If it loses, by −4.8 and Tiburones’s by +4.8. K is 8.
Step 5: after the game
A rating moves by K × (result − expectation). The result is 1 for a win and 0 for a loss. The expectation is the chance from the ratings and home field alone: starters do not move ratings, so a club is not credited twice for a good pitcher. The opponent moves by the same amount the other way. K is 5 in MLB and 8 in the winter leagues.
Example with K = 5: a home team expected to win 60% gains 5 × (1 − 0.6) = 2 points when it wins and loses 5 × 0.6 = 3 points when it loses.
Step 6: a new season
At a season’s first game every rating gives back a share r of its distance to 1500. r is 33% in MLB and 50% in the winter leagues. Clubs change over the winter and the model knows nothing about the moves, so it forgets part of what it learned. The winter leagues have their own r.
Example: with r at 33%, a rating of 1560 goes back to 1540.2.
Step 7: a series
The chance of winning a playoff series (so far a winter league’s final) is counted exactly from the chances of the games still to be played, in the order of home games the schedule gives, for example 2-3-2 in a best of seven. Every way the games can go is added up, so the number is not a simulation.
A series gets a number only when the schedule lists its length, its state and every game it can still have, “if necessary” games included. When the schedule does not say, nothing is guessed.
The Caribbean Series is a tournament at one site, and each of its clubs comes from a league: it carries the rating of that league’s champion, and a club with no league of ours starts at 1500. Home field goes only to the club of the host country, in its own games; every other game is on neutral ground. A semifinal and the final are one game each, so the title chances are a product of single games: a club’s chance to win its semifinal, times, for each club it could meet in the final, the chance that club gets there and the chance to beat it, added up. Nothing is simulated.
Step 8: checking the forecasts
Every forecast is checked against the result, and the check is counted from the record alone: the forecasts as they were written before the game, never worked out again with today’s numbers.
- The Brier score is the average of (forecast − result)², with the result 1 for a home win and 0 for a loss. 0 is perfect and 0.25 is a coin flip. A forecast of 60% scores 0.16 when it comes true and 0.36 when it does not.
- Two simple rules to beat: the coin flip, which always says 50% (0.25), and “the home team always wins”, which always says the home team’s share of wins in the fit (53.9% in MLB and 54.9% in the winter leagues).
- Calibration sorts the games into bands by the favorite’s chance and compares each band’s average forecast with how often the favorite won.
- A backtest scores the model on seasons the fit never saw.
Only finished games count. A forecast counts if it was written before the first pitch, and the last one written before the first pitch is the one kept. A cancelled or tied game stays in the record and is not scored. After a game only its result is added: nothing in the record is deleted or changed.
Step 9: where K, H, r, R and W come from
A fit tries a grid of values and keeps the combination with the smallest Brier score on the training seasons: first the team’s numbers (K, H, r), then the pitcher’s (R, W). Each season in the fit is replayed the way a live run is: everyone starts at 1500, and the Brier score counts only after the same settling, two seasons for MLB and one for the winter leagues.
MLB is fitted on Retrosheet’s games and the winter leagues on MLB Stats API results; the seasons used are in the table. The winter leagues share one K, one H and one r.
| Number | MLB | Winter |
|---|---|---|
| K (points per surprise) | 5 | 8 |
| H (home field, points) | 24 | 32 |
| r (pull toward 1500) | 33% | 50% |
| R (innings of regression) | 300 | – |
| W (points per run) | 150 | – |
| Last season’s weight | 0.5 | – |
| Innings per start | 5.19 | – |
| Home team won | 53.9% | 54.9% |
| Fitted on | 2000–2019 and 2021 | 2016–2023 |
| Tested on | 2022–2025 | 2024–2025 |
| Fitted | Oct. 29, 2026 | Oct. 29, 2026 |
The fit repeats itself: MLB whenever the site’s history is rebuilt, the winter leagues after each winter season ends. Every forecast in the record carries the version of the numbers it was made with.
Calibration
Do the favorites win as often as we say? Games are put in bands by the favorite’s chance, and each band shows the average chance we gave and how often the favorite won.
| Favorite’s chance | Games | Average forecast | Favorite won | Share |
|---|---|---|---|---|
| 50-55% | 8 | 52.0% | 4 | 50% |
| 55-60% | 5 | 57.4% | 4 | 80% |
| 60-65% | 1 | 61.8% | 1 | 100% |
| 65-70% | 0 | – | – | – |
| 70% and up | 0 | – | – | – |
A band holds favorite chances from its low edge up to, not including, its high edge. A game at exactly 50% has no favorite: it is counted in the first band and never as a win for the favorite.
What the model does not know
- Lineups and rest days: who plays tonight and who sits.
- Injuries and roster moves. A rating learns only from results, so a trade or an injury shows up only after the games.
- Bullpens: who is rested or tired, and who pitches after the starter.
- Weather, ballpark and umpire.
- Moves over the winter. A new season only brings every rating part of the way back to 1500.
- Winter-league starters: they are not counted.
- Betting odds and other people’s forecasts: none are used. Only MLB Stats API results and Retrosheet’s history go in.
- How a game is going. The win probability and the Drama Index in the Daily describe a game while it is played, with a different model; a forecast is made before the first pitch.
Data and sources
Results, schedules, announced starters and pitchers’ numbers come from the MLB Stats API.
The MLB model is fitted on Retrosheet’s play-by-play history, which the site builds into its own data, and the winter leagues’ model on MLB Stats API results.
Each forecast in the record carries the version of the numbers it was made with. The numbers now in use:
- MLB: version 4070baad, fitted Oct. 29, 2026.
- Winter: version b099bc3c, fitted Oct. 29, 2026.
The information used here was obtained free of charge from and is copyrighted by Retrosheet. Interested parties may contact Retrosheet at “www.retrosheet.org”.
How our forecasts did
Our forecasts, Oct. 25-31: 14 games · favorites won 9 (64%) · Brier 0.228 (coin flip 0.250, home team always 0.224) · winter so far 0.228
The Daily Whiff · Sunday, Nov. 1, 2026 Page 5
Around the Web
News
- Braves News: Dana Brown, Vidal Brujan back, more — Yahoo Sports
- Skirka to speak at OBA’s Best Ever Coaches Clinic — Canadian Baseball Network
- Yankees’ Spencer Jones, girlfriend get engaged at Empire State Building: ‘Forever starts today’ — Yahoo Sports
- McFarland: Baseball Sask’s Kilshaw reflects on dream year — Canadian Baseball Network
Transactions & Rumors
- Rays Exercise Club Option On Drew Rasmussen — MLB Trade Rumors
- Elly De La Cruz’s Luka Doncic trolling adds twist to Dodgers trade rumors — Yahoo Sports
- Orioles Make Multiple Roster Moves — MLB Trade Rumors
- Some Offseason Trade Targets for the Guardians — Yahoo Sports
Analysis · Prospects (4)
Analysis
- Looking at 3 Yankees’ Prospects With Momentum Going Into 2027 — Just Baseball
- Flores Blooms — Baseball Musings
- In 58th Season, Brewers Finally Make Fans’ Dreams Come True — Just Baseball
Prospects
- 2026 Houston Astros Org Prospect Team — Prospects Live
Terms in this edition
Drama Index: Our own measure of how much a game kept both sides guessing: the total of every swing in win probability over the game, divided by 100. A game that one team controls from the first inning scores low; a game full of lead changes and late swings scores high.
Leverage Index (LI): How much the next plate appearance can swing win probability, compared with an average plate appearance. 1.0 is average; 2.0 means twice the usual stakes.
Win Probability Added (WPA): How much one play changed a team’s chance of winning. The batter is credited with the change and the pitcher is charged the same amount with the opposite sign; add up a player’s plays and you get his WPA for a game or a season.
Elo Rating: A single number for a team’s strength that goes up after a win and down after a loss, by more when the result was a surprise. The average club sits at 1500, and the gap between two ratings gives each club’s chance to win. Arpad Elo designed it to rank chess players.
Home-Field Advantage: The edge a team has when it plays in its own park: the last at-bat, the familiar park, no travel and the crowd. In MLB the home team wins a little more than half of its games, so our forecast gives the home team extra rating points (the fitted value is on the Forecast page).
Fielding Independent Pitching (FIP): An ERA-style number built only from the outcomes a pitcher controls most directly: strikeouts, walks, hit batters and home runs. Balls in play that stay in the park are ignored.
Regression to the Mean: Extreme results tend to be followed by less extreme ones, because part of any extreme result is luck, and luck does not carry over.
Brier Score: The average of (forecast − result)² over many forecasts, where the result is 1 if the event happened and 0 if not. A forecast of 60% that comes true scores 0.16 and one that fails scores 0.36. Lower is better: 0 is perfect, and 0.25 is what saying 50% every time scores.
Calibration: Whether a forecast’s percentages mean what they say: among the games where the favorite was given about 65%, the favorite should win about 65% of them. It is checked by putting games into bands of the favorite’s chance and comparing each band’s forecast with how often the favorite won.
Sources & Notes
Built automatically from MLB Stats API data; numbers through Oct. 31, 2026, with FIP, xFIP, WAR and wRC+ up to a day behind. How this site works